【Dollar/Yen / Euro/Dollar / Pound/Yen】Market analysis for Thursday, May 21, 2020
【Dollar/Yen / Euro/Dollar / Pound/Yen】 Market Analysis for May 21, 2020 (Thu)
Good morning, everyone! It’s Yururi mo Yururi.
Thank you very much for visiting this blog.
May 21, 2020 (Thu)I have updated the blog with market analysis.
Three currency pairs: Dollar/Yen, Euro/Dollar, and Pound/Yenare written about.
Please take a look!
<<< Koropokkuru ~ Automatic horizontal line display ~ >>>
<<< Koropokkuru ~ Triple display of moving averages ~ >>>
<<【Dollar/Yen / Euro/Dollar / Pound/Yen】 May 21, 2020 Market Analysis >>

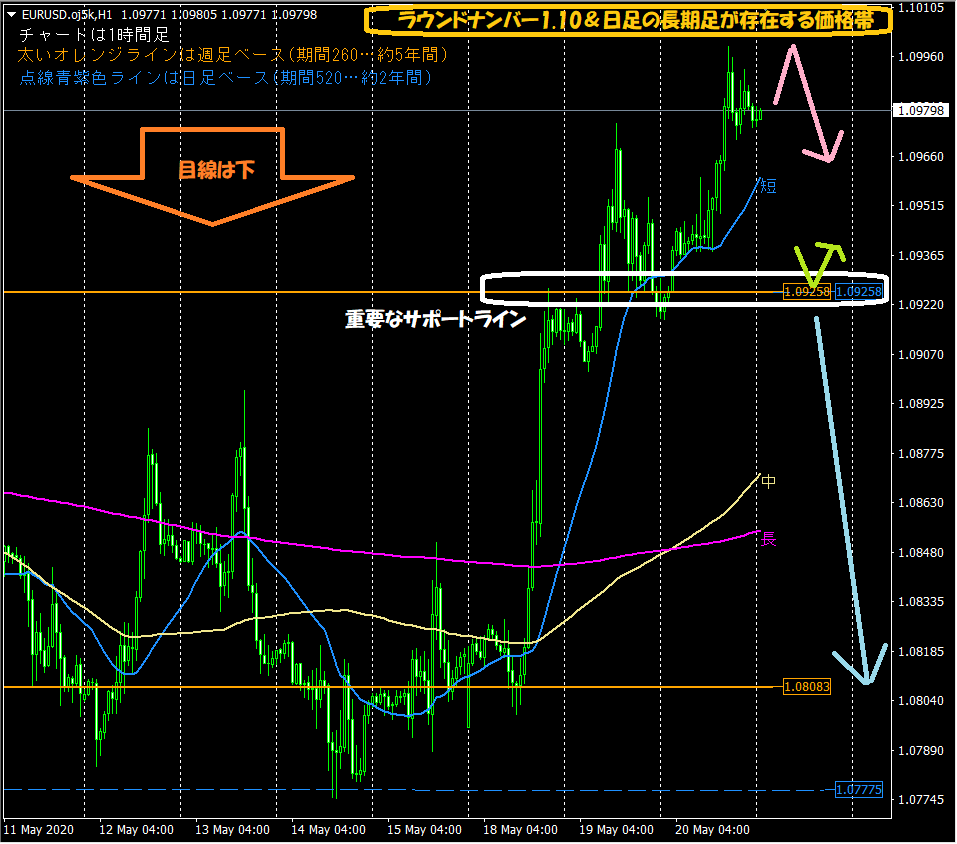
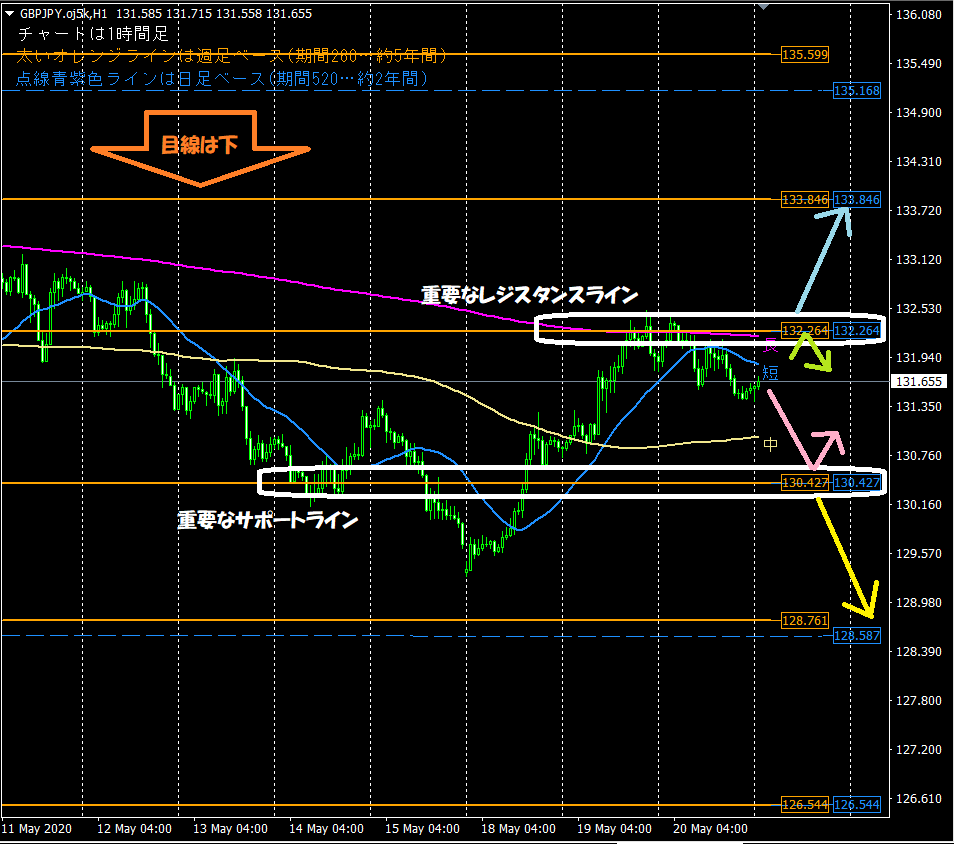
【Images used for Dollar/Yen chart analysis】

This week’s market analysis is also on the blog. If you haven’t read it yet, please take a look.
<<【Dollar/Yen / Euro/Dollar / Pound/Yen】 May 18, 2020 - May 22, 2020 Market Analysis>>
【Backtest of Koropokkuru Series Indicators】
This is a video of backtesting the indicators for last week (May 11–15, 2020).
This is the 1-hour chart used in the blog’s chart analysis every morning. The two points to look at are below.1. The horizontal lines automatically displayed by the indicators are functioning as support/resistance
⇒ Thick orange line (weekly base, period 260… 5 years), purple dashed line (daily base, period 520… 2 years)
2. The moving averages optimized for the 1-hour chart are often respected
⇒ Especially the short-term line (period 24… 1 day) and the long-term line (period 480… 1 month)
【Product for sale: ‘Koropokkuru ~ Automatic Horizontal Line Display ~’ Introduction】
The indicators used in market analysis are designed to automatically display horizontal lines to reduce trading burden and help with analysis.
They analyze the highest and lowest prices within a set period by price range and automatically display up to three optimal horizontal lines across up to three timeframes.
Highly recommended for busy office workers and housewives.
If you want to purchase or are a little interested, please go to the product page via the link below!
<<<Koropokkuru ~ Automatic Horizontal Line Display ~>>>

【Product for sale: ‘Koropokkuru ~ Moving Averages Triple Display ~’ Introduction】
The moving averages used in market analysis are displayed by the newly released indicator “Koropokkuru ~ Moving Averages Triple Display ~”!
This indicator is for those who are puzzled about introducing and using moving averages.
Have you ever analyzed FX or stocks and studied or contemplated implementing moving averages?
In such cases,you may have had concerns such as below.
・Tried implementing moving averages but can’t determine the best values to set for parameters, especially the ‘period’.
・Implemented too many moving averages and lost track of what’s correct… want to reset the over-implementation!
・Some sites use one moving average, others five— which is correct?
・Tried implementing moving averages in your own way but feel uncertain about correctness.
Our indicator solves all those concerns!
If you want to purchase or are a little interested, please go to the product page via the link below!
<<<Koropokkuru ~ Moving Averages Triple Display ~>>>

【Product for sale: ‘Koropokkuru ~ Angle is Power Series ~’ Introduction】
An indicator that emphasizes the angle of MACD and OsMA as a signal.
The Standard version focusing on reliability, and the Early version focusing on early detectionare prepared.
Please take a look!
<<【All 4 Types Best Set】 Koropokkuru ~ Angle is Power Series ~ >>

Backtest results of the indicators are公開しています。
We have published results for other currency pairs and timeframes, so please refer to them.
An indicator that emphasizes the angle of MACD and OsMA as a signal.
The Standard version focusing on reliability, and the Early version focusing on early detectionare prepared.
Please take a look!
<<【All 4 Types Best Set】 Koropokkuru ~ Angle is Power Series ~ >>
Backtest results of the indicators are公開しています。
We have published results for other currency pairs and timeframes, so please refer to them.
We are also active on Twitter, so please follow us!
<< Yururi mo Yururi Twitter >>

【Finally】
Thank you for reading this blog until the end!
We hope it can assist in your asset management.