Aiming for 300-400 pips per month: "Motty-style day trading method"!
【Important: Preface】
The background of why we decided to sell this method is as follows,
I traded FX for four and a half years up to 2017
and tried various methods and indicators.
I also bought products.
However, I couldn't keep earning consistently.
But after twists and turns, from 2016 I joined FX study groups,
and was taught by professional traders,
began to take FX seriously, and conducted many verifications and practice,
ultimately arriving at a simple and stable method (trading rules),
and as a part-time trader I was able to earn consistently 100-200 pips or more per month.
I still use this method and make profits.
Additionally, as a result of repeated testing and producing data,
if you can trade full-time,
a method that can reliably earn 300-500 pips or more per month in total if you trade according to the rules
has been developed.
The following is an excerpt from the main content
The fundamental prerequisites for consistently winning in trading
☑ Enter only at edge entry points of the method
☑ Never enter based on gut feeling
☑ Even if momentum is strong, wait for a pullback and enter Always consider the psychology of market participants and trade with contrarian thinking
☑ If you miss an entry point, wait for the next opportunity, even if it takes time Be mindful of economic indicators and major announcements and avoid trading around them
☑ Always set a stop loss at a predetermined point. If you enter on the 5-minute chart, take profit/stop loss based on the 5-minute chart's justification. Do not set take-profit or stop based on how much profit remains to reach a target
☑ Strive to trade mechanically without greed (eliminate emotions)
Day trading method (trading rules)
Do nothing except at edge points.
In day trading as well as scalping, what matters is volatility and directional bias.
The amount of time you can trade in a day varies from person to person, but if there is no volatility or directional bias during the time you look at the chart to trade, you basically do nothing.
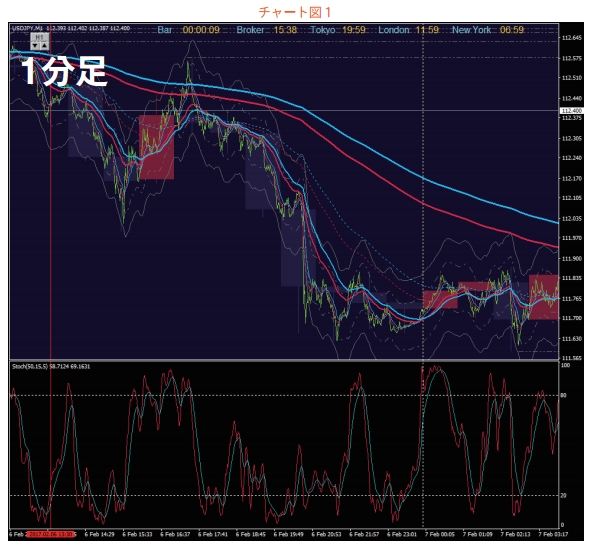
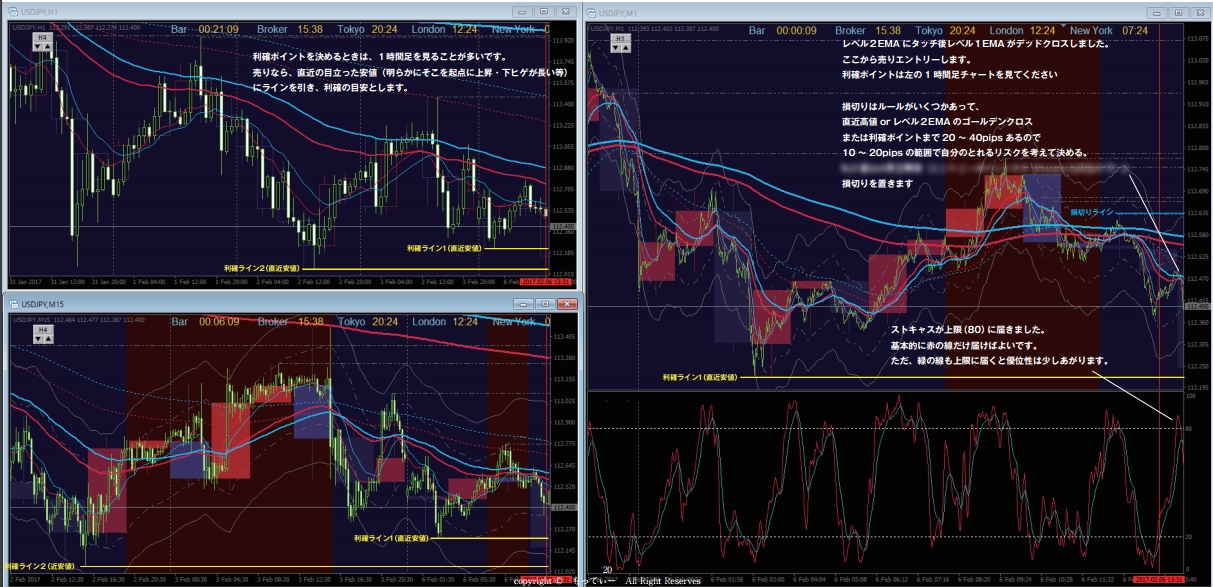
A market like Chart 1 (1-minute) with an edge to the downside, where candles frequently touch the Envelope (line chart), is the most suitable for trading. In other words, please focus your trading on such market conditions. For example, if you were watching the market in Chart 1 in real time (the red vertical line marks “now”), and here is a rough explanation of the entry rules
If you are viewing such a chart in real time, your job is to enter by selling to catch a pullback. And to determine where to target the pullback, please pay attention to the Stochastic and the 1-minute level-2 EMA.
【Basic Rules】
At first you may not understand the meaning of the explanation, but in simple terms:
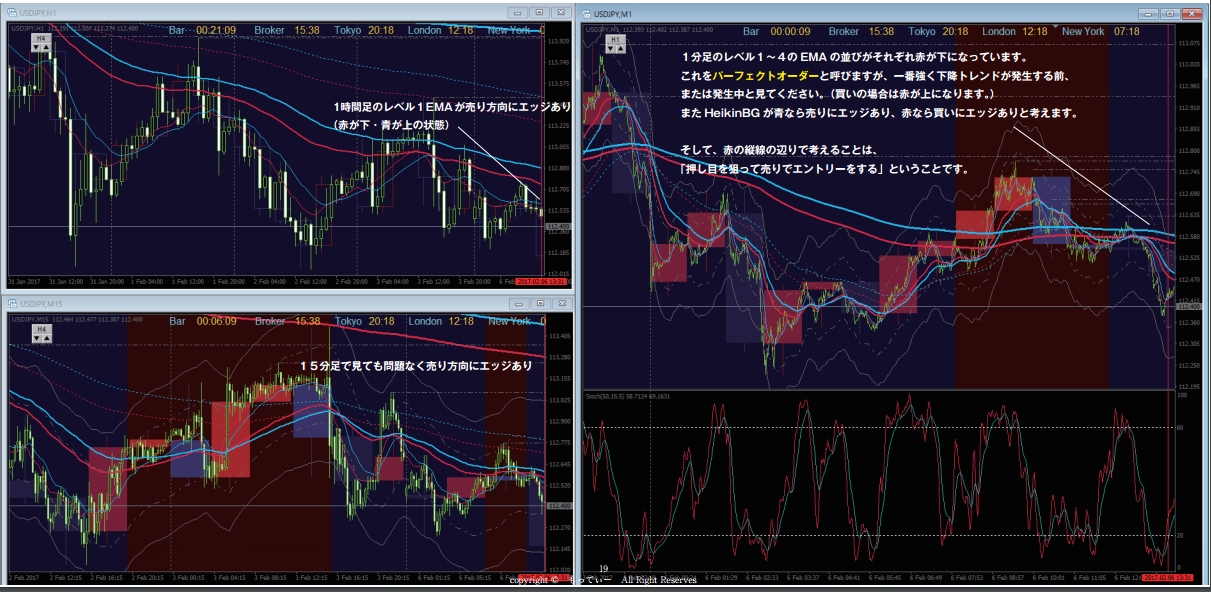
・The arrangement of the EMA at 1-minute levels 1–4 and the 1-hour level 1 EMA
Basically, focus on the arrangement of the 1-hour Level-1 EMA and the 1-minute EMA levels 1–4.
However, since the 1-hour Level-1 EMA and the 1-minute Level-4 EMA are almost the same,
you can also just pay attention to the 1-minute EMA.
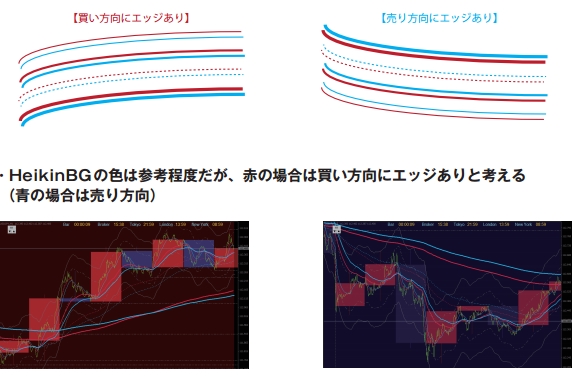
If the EMA levels 1–4 are red and higher, there is an edge to buy (consider buying)
If the EMA levels 1–4 are blue and higher, there is an edge to sell (consider selling)
・Enter in the direction of the edge indicated by the EMA arrangement.
However, for pullbacks (or line breaks), the time frame used for entry is basically the 1-minute chart. Entry occurs when the arrangement of EMA levels 1–3 or 1–4 on the 1-minute chart aligns in the trend direction (sell or buy), after the Stochastic upper/lower bound or 50 touches or crosses the red line (or red and green both), and the Level 1 EMA crosses in the trend direction. Or, after touching EMA levels 2–4 (pullback) and then moving down (up) and the Level 1 EMA crosses in the trend direction, or when both conditions are met.
The free version that reveals more details
Limited to 500 copies distributed!
Video here!
Product sales page here!
↓↓↓↓
A simple, no-frills method that reliably earns 300–500 pips per month