【Dollar/Yen/Euro/Dollar, Pound/Yen】Market analysis for Tuesday, May 12, 2020
【Dollar/Yen / Euro/Dollar / Pound/Yen】 Market Analysis on Tuesday, May 12, 2020
Good morning, everyone! This is Yururi-mo Yururi.
Thank you very much for visiting this blog.
On Tuesday, May 12, 2020I updated the blog with a market analysis.
Three currency pairs: Dollar/Yen, Euro/Dollar, Pound/Yenare written about.
Please take a look!
<<< Koropokkuru – Automatic Horizontal Line Display >>>
<<< Koropokkuru – Triple Moving Average Display >>>
<<【Dollar/Yen/Euro/Dollar/Pound/Yen】 May 12, 2020 Market Analysis >>

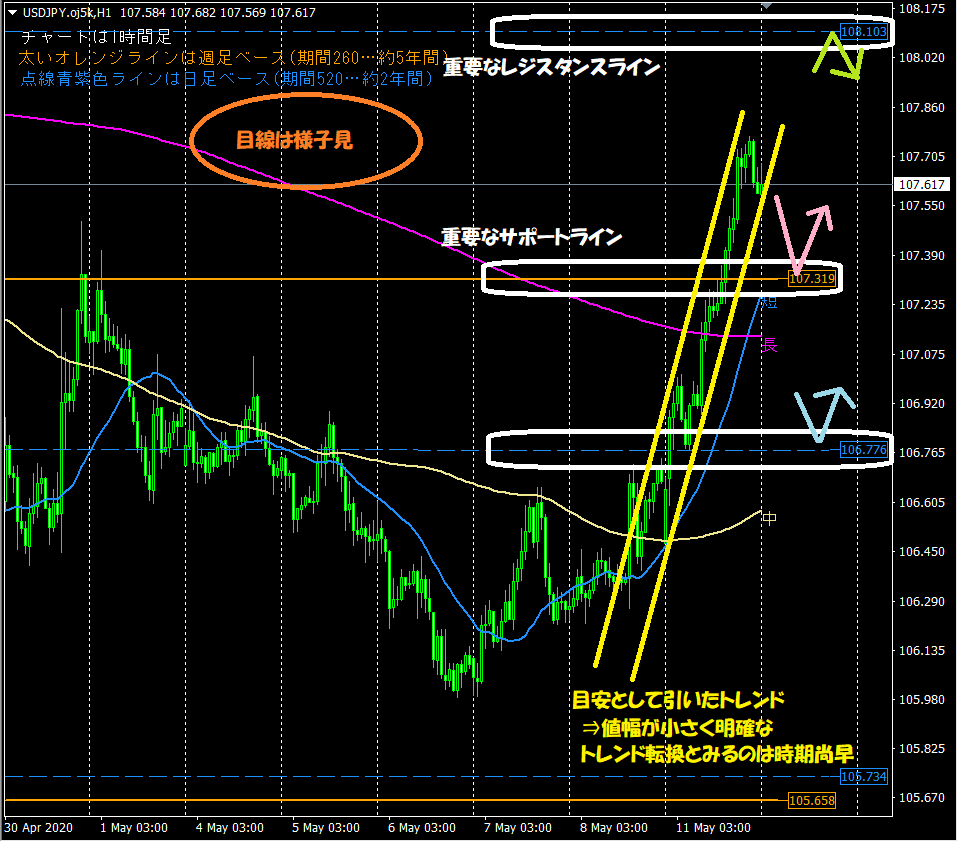
【Image used for Dollar/Yen chart analysis】
This week's market analysis is also written on the blog. If you haven't read it yet, please take a look.
<<【Dollar/Yen/Euro/Dollar/Pound/Yen】 May 11–May 15 Market Analysis >>
【Backtest of Koropokkuru Series Indicator】
This is a video of backtesting the indicator for last week (April 27–May 1, 2020).
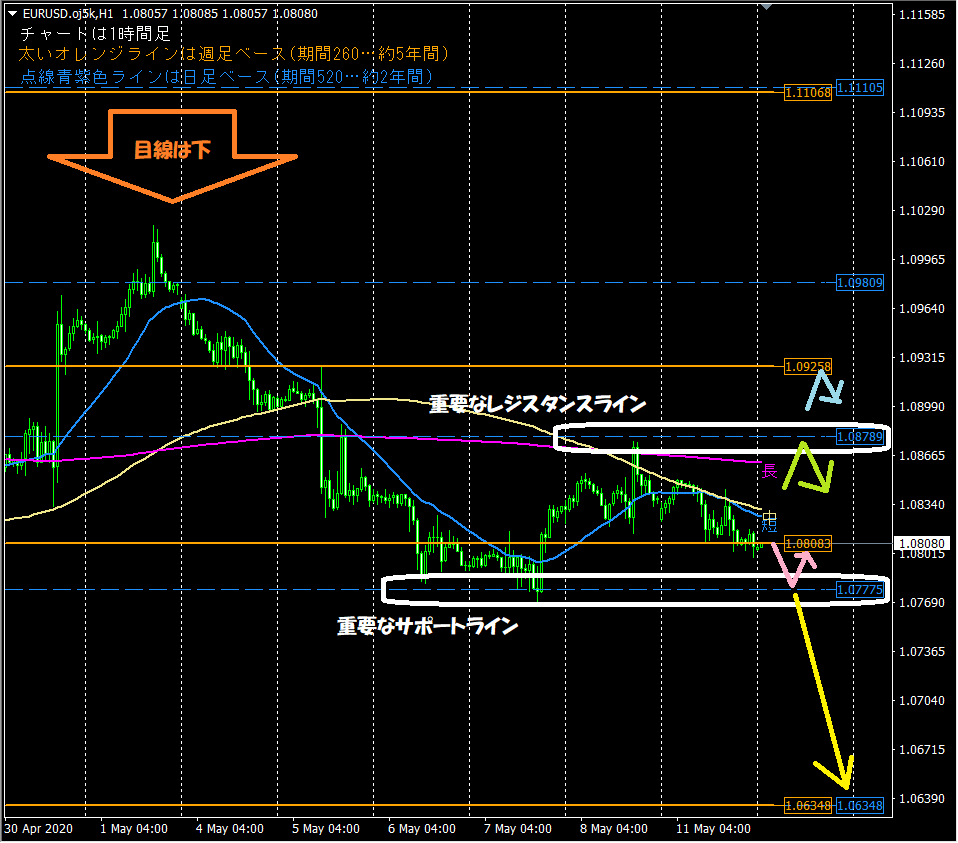
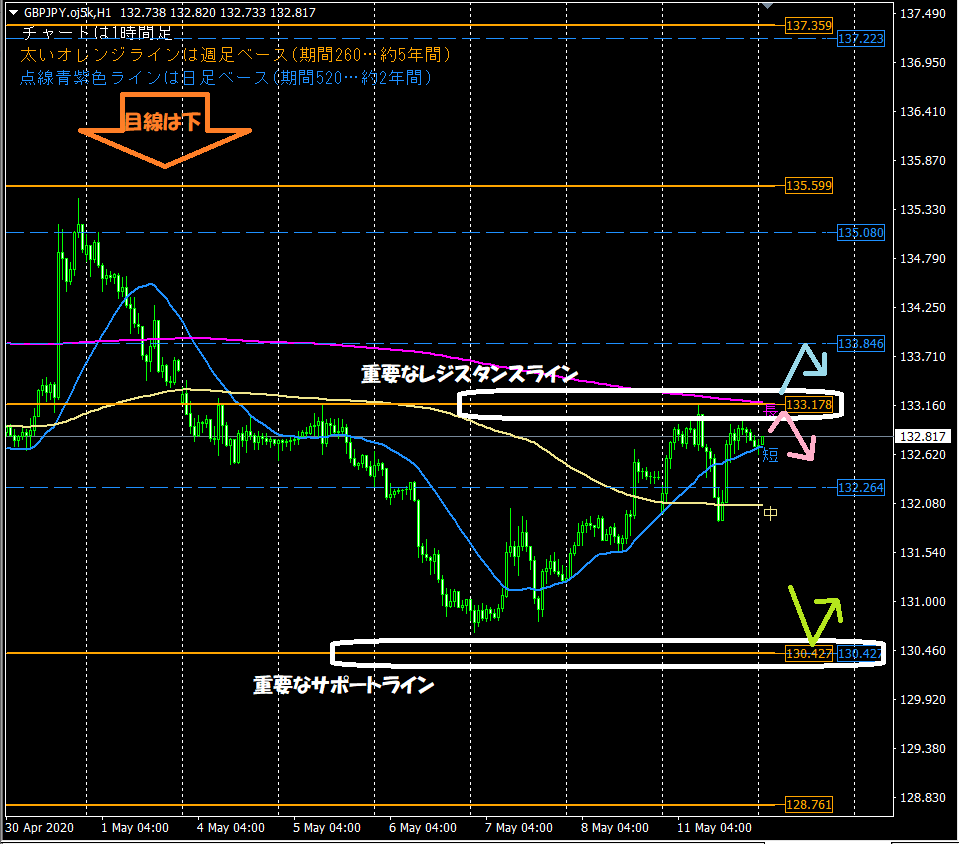
This is the 1-hour chart used in the blog's chart analysis every morning. Important points to look at are the following two:1. The horizontal lines automatically displayed by the indicator act as support/resistance
⇒ Thick orange line (weekly basis, period 260…5 years), purple dashed line (daily basis, period 520…2 years)
2. Moving averages optimized for the 1-hour chart are often observed
⇒ Especially the short-term line (period 24…1 day) and the long-term line (period 480…1 month)
【Product for Sale: 'Koropokkuru – Automatic Horizontal Line Display'】
The indicators used in market analysis are designed to automatically display horizontal lines to reduce trading load, and were created for that purpose.
They analyze the highest and lowest prices within a set period by price band and automatically display up to three optimal horizontal lines across up to three timeframes.
Highly recommended for busy office workers and housewives.
If you want to purchase or are just curious, please go to the product page from the link below!
<<<Koropokkuru – Automatic Horizontal Line Display>>>

【Product for Sale: 'Koropokkuru – Triple Moving Average Display'】
The moving averages used in market analysis are displayed with the newly released indicator "Koropokkuru – Triple Moving Average Display"!
This indicator is for those who are puzzled about introducing and using moving averages.
Have you ever analyzed FX or stocks and considered introducing moving averages?
If so,you may have had worries like the following.
・You tried introducing moving averages but still don't know the best values to set for parameters. Especially the 'Period'.
・You introduced too many moving averages and lost sight of what's correct… you want to reset the overly complex setup!
・Sites you reference show 1 moving average or 5—how many are correct?
・You tried implementing moving averages in your own way but feel uncertain about correctness.
This indicator solves all those concerns!
If you want to purchase or are slightly curious, please go to the product page from the link below!
<<<Koropokkuru – Triple Moving Average Display>>>

【Product for Sale: 'Koropokkuru – Angles are Key Series'】
An indicator that emphasizes the angle of MACD and OsMA as a signal.
'Standard' version focused on reliability, and 'Early' version focused on early detection are prepared.
Please take a look!
<<【All 4 Types Best Set】 Koropokkuru – Angles are Key Series >>

Backtest results of indicators are公開しています。
Other currency pairs and timeframes are also published, so please refer to them.
An indicator that emphasizes the angle of MACD and OsMA as a signal.
'Standard' version focused on reliability, and 'Early' version focused on early detection are prepared.
Please take a look!
<<【All 4 Types Best Set】 Koropokkuru – Angles are Key Series >>
Backtest results of indicators are公開しています。
Other currency pairs and timeframes are also published, so please refer to them.
I’m also active on Twitter, so please follow me!
<< Yururi mo Yururi on Twitter >>

【In Closing】
Thank you for reading this blog until the end!
I hope it will be a help in your asset management.