
[FX full-time trader cat's pound-yen trade analysis 0424]
Let's look at the daily chart for GBP/JPY.
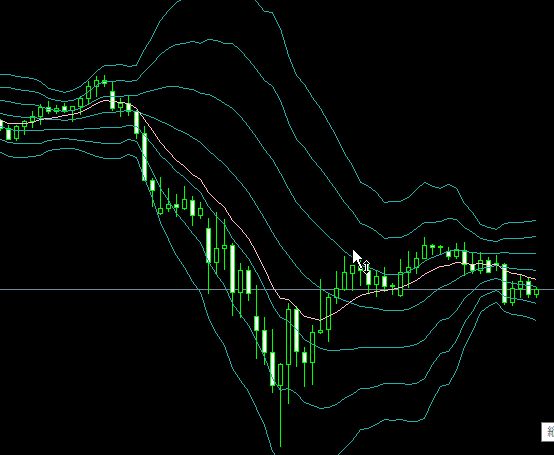
Even though it expanded, there was no momentum. In such cases, a so-called misleading expansion or head fake could be in play.
The weekly chart shows

of course there are enough bearish indications, but the opposite band is still visible as closing in.
And the monthly chart
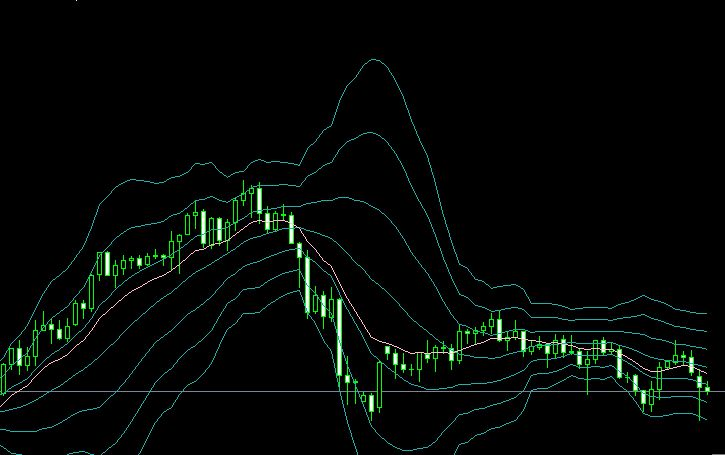
From a monthly perspective, it can be regarded as bearish.
Let's examine the 4-hour chart.
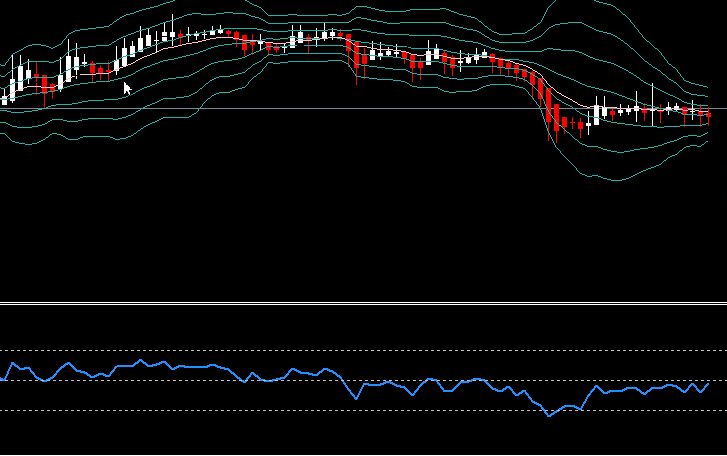
It squeezed according to the N-Method criteria. In my own trading, I attempted to sell on pullbacks, but it was difficult, so in N-Method it was a market where after capturing the downward move from the expansion, one should have waited with no entry. RSI was below 50 indicating weakness, but the middle band is flat. In this state, there is a high probability of oscillating between 2 standard deviations, but since it is squeezing, whether trading against or with the trend requires caution as described in the N-Method.
Next week there is the Bank of Japan policy meeting, will it provide a good selling opportunity?
Oops, even if you anticipate or imagine something, you must not trade on that. A skeptical mindset is precisely what traders need.