【USD/JPY/EURUSD/GBPJPY】Market analysis for Thursday, April 23, 2020
【USD/JPY/EURUSD/GBPJPY】Market Analysis for Thursday, April 23, 2020
Good morning, everyone! This is Yururi mo Yururi.
Thank you very much for visiting this blog.
We have updated a blog post on the market analysis for Thursday, April 23, 2020.It covers the three currency pairs: USD/JPY, EUR/USD, and GBP/JPY.
USD/JPY/EURUSD/GBPJPY — the three currency pairs discussed.
USD/JPY/EURUSD/GBPJPY — the three currency pairs
<<【USD/JPY/EURUSD/GBPJPY】Market Analysis for Thursday, April 23, 2020>>

We have started selling the new indicator “Koropokkuru ~ Angle is Life Series ~”!
An indicator that displays signals prioritizing the angle of MACD and OsMA.
The Reliable Standard Version and the Early Detection Version are available.
Please take a look!
<<【All 4 Types Best Set】 Koropokkuru ~ Angle is Life Series ~>>
We have published backtest results for the indicators.

We also publish information on other currency pairs and timeframes, so please refer to it.
<<Koropokkuru ~ Angle is Life Series ~ Standard Early Backtest Results>>
We have also written this week's market analysis on the blog. If you haven't read it yet, please take a look.
<<【USD/JPY/EURUSD/GBPJPY】Market Analysis for April 20–April 24, 2020>>
【Backtest for Koropokkuru Series Indicator】
This video shows backtesting of the indicator for last week (March 23–27, 2020).
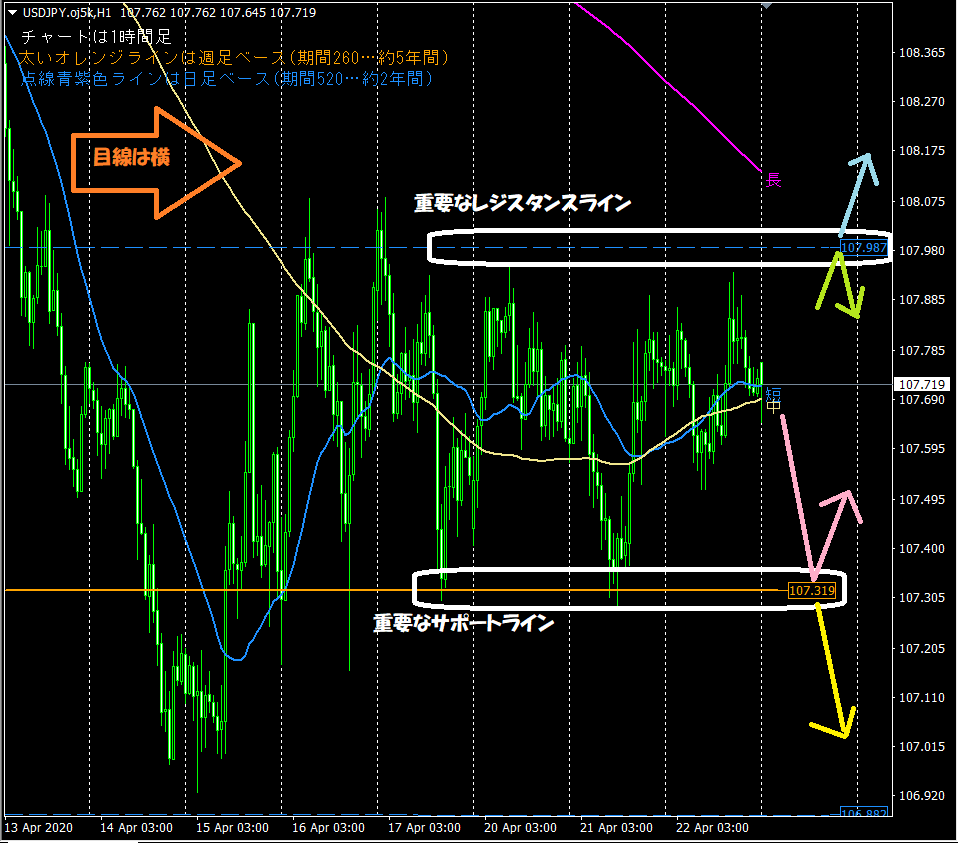
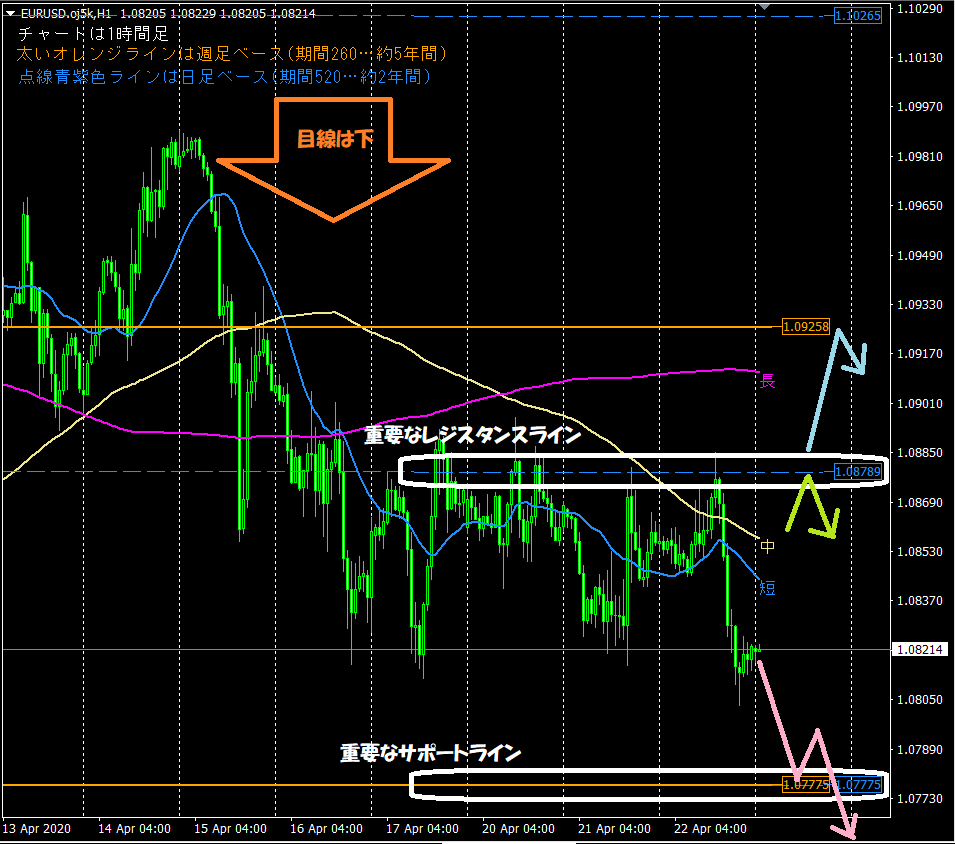
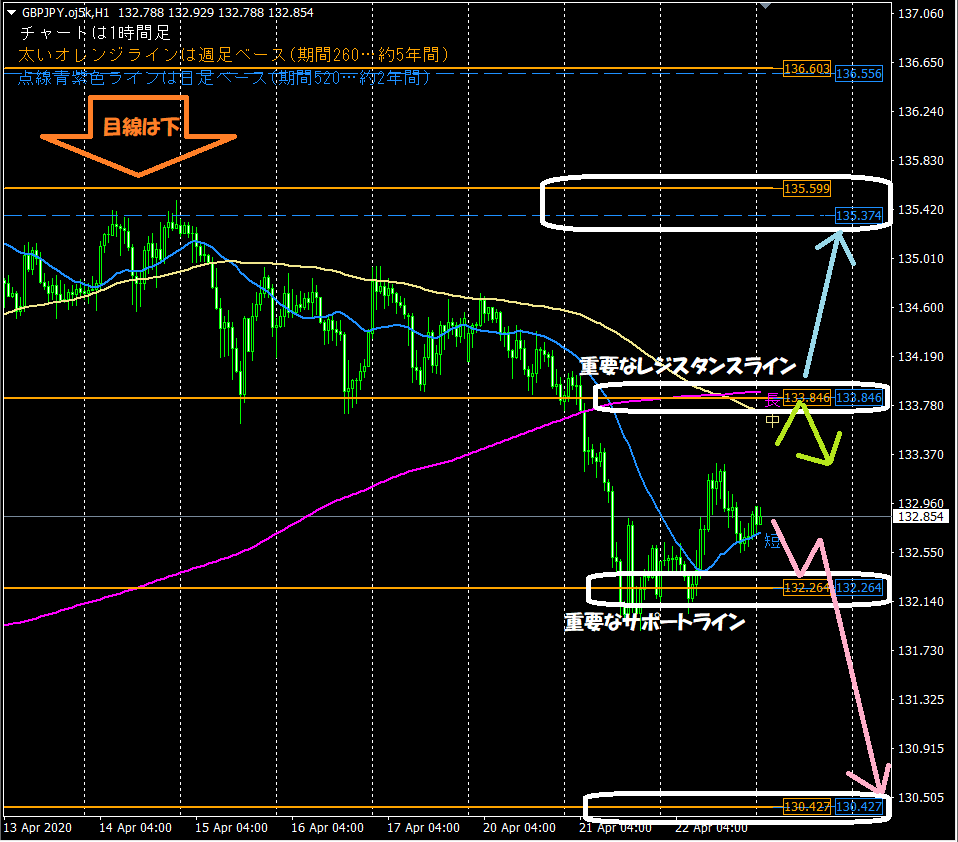
This is the 1-hour chart used in the blog's daily chart analysis in the mornings. Two points to look at are:1. The horizontal lines automatically displayed by the indicator function as support/resistance
⇒ Thick orange line (weekly basis, period 260… 5 years), purple dashed line (daily basis, period 520… 2 years)
2. Moving averages optimized for the 1-hour chart are often respected
⇒ Especially the short-term line (period 24… 1 day) and the long-term line (period 480… 1 month)
【Introduction of Product for Sale ‘Koropokkuru ~ Automatic Horizontal Lines’】
The indicators used for market analysis were designed to automatically display horizontal lines to reduce trading load. and help you determine the best horizontal lines.
Analyzes the highest and lowest prices within a set period by price tier and automatically displays up to three optimal horizontal lines across up to three timeframes..
Highly recommended for busy professionals and homemakers.
If you want to buy or are curious, please go to the product page from the link below!
<<<Koropokkuru ~ Automatic Horizontal Lines>>>

【Introduction of Product for Sale ‘Koropokkuru ~ Triple Moving Averages Display’】
The moving averages used in market analysis are displayed by the newly releasedIndicator “Koropokkuru ~ Triple Moving Averages Display”!
This indicator is for those who are unsure how to introduce or use moving averages.
Have you ever analyzed FX or stocks or studied them and considered introducing moving averages?
In such cases,you may have had the following concerns
・You tried moving averages but can’t determine the best parameter values to set, especially the ‘Period’.
・You added too many moving averages and aren’t sure what’s correct… you want to reset from overuse.
・Sites you refer to show one, five, or various moving averages, but which is correct?
・You tried implementing moving averages in your own way but aren’t confident it’s correct.
Our indicator solves all such problems for you!
If you want to buy or are curious, please go to the product page from the link below!
<<<Koropokkuru ~ Triple Moving Averages>>>

We also are active on Twitter, so please follow us!
<< Yururi mo Yururi Twitter >>

【In Conclusion】
Thank you for reading this blog until the end!
I hope it will be a helpful resource for your asset management.