【USD/JPY/EURUSD/GBPJPY】Market analysis for Wednesday, April 22, 2020
【Dollar/Yen/EUR/USD/GBP/JPY】Market Analysis on Wednesday, April 22, 2020
Good morning, everyone! This is Yururi mo Yururi.
Thank you very much for visiting this blog.
We have updated the blog on the market analysis for Wednesday, April 22, 2020.We write about the three currency pairs: Dollar/Yen, Euro/Yen, and Pound/Yen.
Please take a look!
<<【Dollar/Yen/Euro/Yen/Pound/Yen】Market Analysis for April 22, 2020 (Wed)>>

We have started selling a new indicator 'Kuropokkuru ~ The Angle is Life Series ~'!
An indicator that emphasizes the angles of MACD and OsMA to display signals.
The 'Standard' version emphasizing reliability, and the 'Early' version emphasizing early detection are available.
Please take a look!
<<【All 4 Types Best Set】 Kuropokkuru ~ Angle Is Life Series ~>>
We have published backtest results for the indicator.

We also publish information on other currency pairs and time frames, so please refer to them.
<<Kuropokkuru ~ Angle is Life Series ~ Standard Early Backtest Results>>
We also write about this week’s market analysis on the blog. If you haven’t read it yet, please have a look.
<<【Dollar/Yen/Euro/Yen/Pound/Yen】Market Analysis for April 20–24, 2020>>
【Backtest of Kuropokkuru Series Indicators】
This is a video showing backtesting of the indicator for last week (March 23–27, 2020).
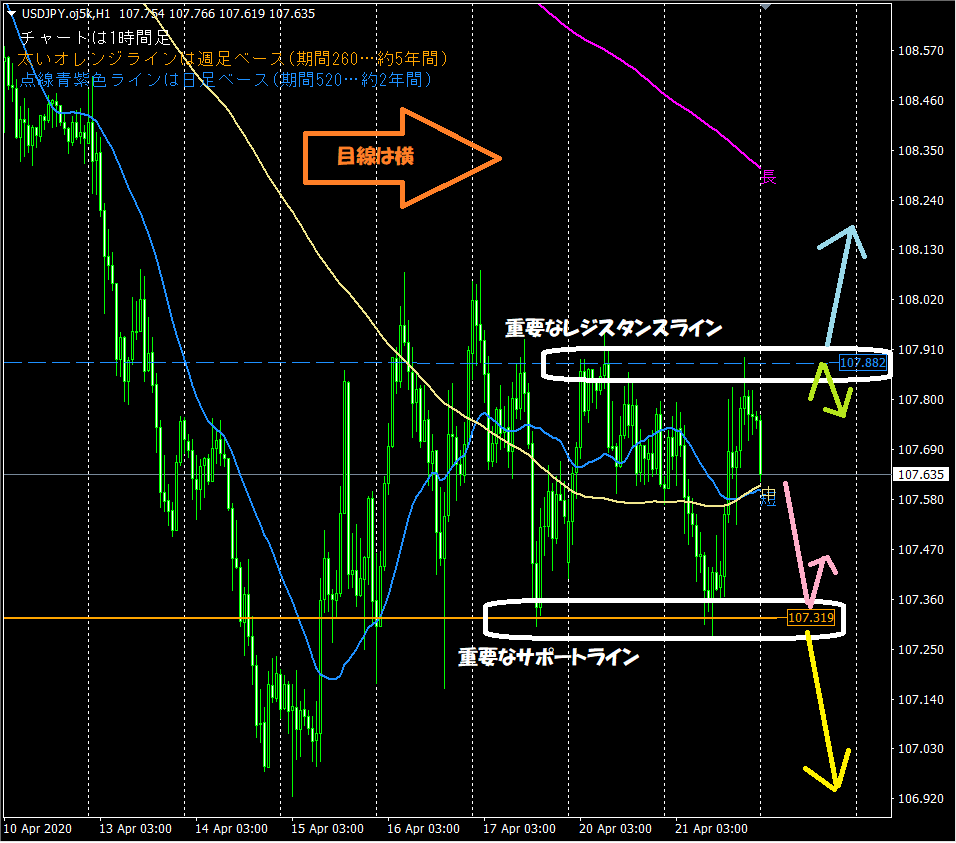
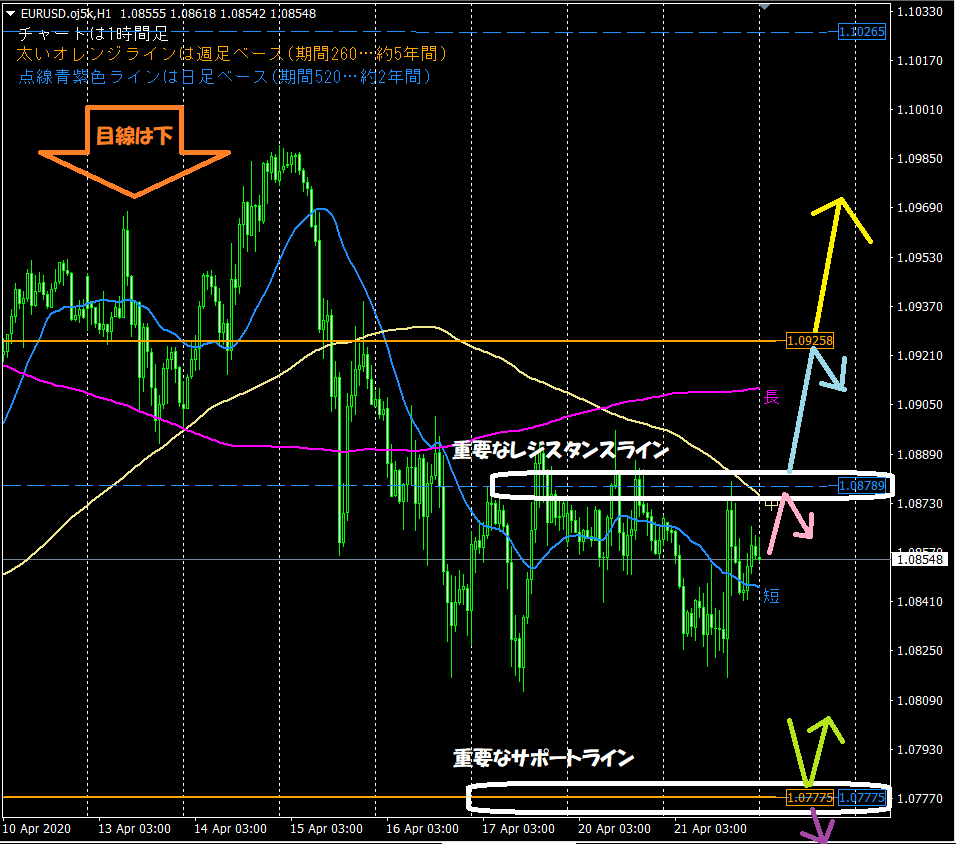
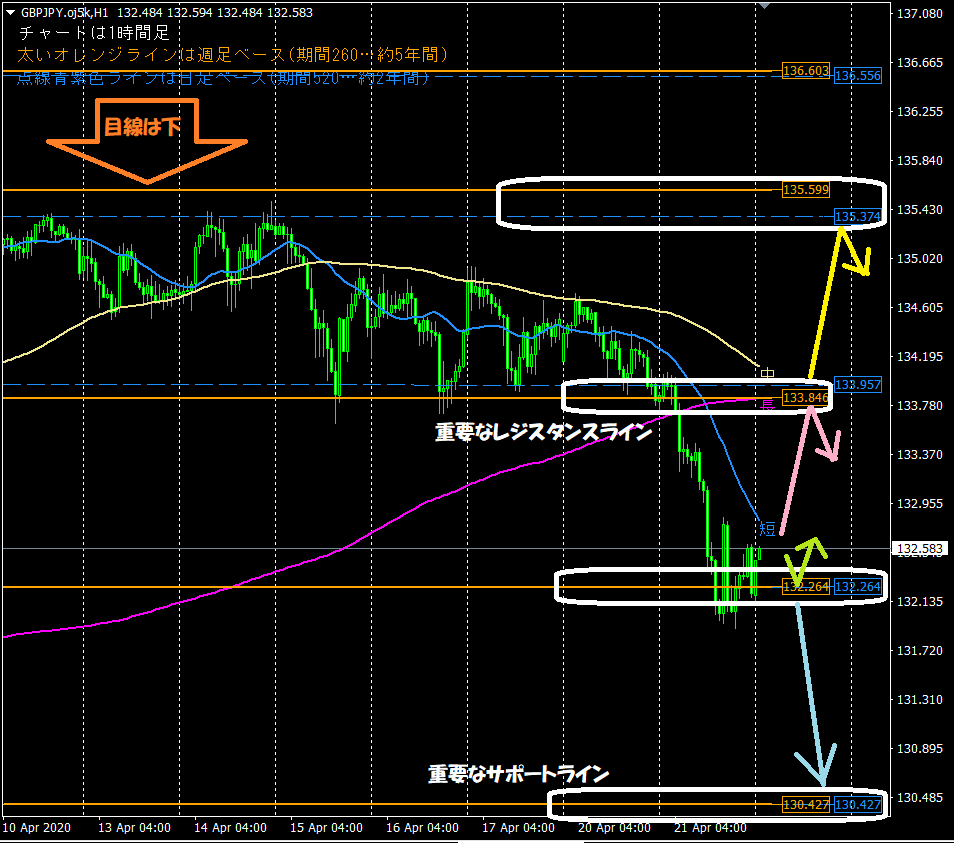
This is the hourly chart used in the blog's chart analysis every morning. The two main points to look at are below.1. The horizontal lines automatically displayed by the indicator are functioning as support/resistance
⇒ Thick orange lines (weekly basis 260 periods… about 5 years), purple dashed lines (daily basis 520 periods… about 2 years)
2. Moving averages optimized for the hourly chart are often regarded
⇒ Especially the short-term line (period 24… 1 day) and the long-term line (period 480… about 1 month)
【Introduction to the Available Product 'Kuropokkuru ~ Auto Display of Horizontal Lines ~'】
The indicators used in market analysis were designed to automatically display horizontal lines to reduce trading workload. They’re intended to automatically display optimal horizontal lines up to three types across multiple timeframes..
Analyzing the highest and lowest prices within a defined period by price band, it automatically displays the most suitable horizontal lines across up to three timeframes.
Highly recommended for busy professionals and housewives!
If you want to purchase or are a bit curious, please go to the product page from the link below!
<<<Kuropokkuru ~ Auto Display of Horizontal Lines ~>>>

【Introduction to the Available Product 'Kuropokkuru ~ Triple Display of Moving Averages ~'】
The moving averages used in market analysis are shown by the newly released indicator "Kuropokkuru ~ Triple Display of Moving Averages ~"!
This indicator is aimed at those who are unsure about introducing or using moving averages.
Have you ever studied market analysis or trading in FX or stocks and considered introducing moving averages?
In such cases,you may have had these concerns
・Tried introducing moving averages but don’t know the best values for parameters, especially the 'Period'.
・Introduced too many moving averages and lost track of what’s correct… want to reset the overuse!
・Different sites show 1 moving average or 5 moving averages, which is correct?
・Tried to customize moving averages but still unsure if it’s right.
This indicator is designed to solve all of these concerns!
If you want to purchase or are a bit curious, please go to the product page from the link below!
<<<Kuropokkuru ~ Triple Display of Moving Averages ~>>>

We are also active on Twitter, so please follow us!
<< Yururi mo Yururi Twitter >>

【Lastly】
Thank you for reading this blog until the end!
We hope it helps your asset management.