[USDJPY/EURUSD/GBPJPY] Market analysis for Tuesday, April 21, 2020
【USD/JPY, EUR/USD, GBP/JPY】Market Analysis for Tuesday, April 21, 2020
Good morning, everyone! This is Yururi mo Yururi.
Thank you very much for visiting this blog.
Market analysis for Tuesday, April 21, 2020has been updated on the blog.
Three currency pairs: USD/JPY, EUR/USD, GBP/JPY are discussed.Please take a look.
Please check it out!
<<【USD/JPY, EUR/USD, GBP/JPY】Market Analysis for Tuesday, April 21, 2020>>

We have released a new indicator titled “Koroppokuru ~ Angles Are Life Series ~”
An indicator that displays signals emphasizing the angles of MACD and OsMA.
The “Standard” version focusing on reliability and, the “Early” version focused on early detection are available.
Please take a look when you have a moment!
<<【All 4 Types Best Bundle】 Koroppokuru ~ Angles Are Life Series ~>>
We have published results of backtesting the indicators.

We also publish for other currency pairs and timeframes, so please refer to them.
<<Koroppokuru ~ Angles Are Life Series ~ Standard Early Backtest Results>>
We also write about this week's market analysis on the blog. If you haven't read it yet, please take a look.
<<【USD/JPY, EUR/USD, GBP/JPY】 Market Analysis from April 20, 2020 to April 24, 2020>>
【Backtest of Koroppokuru Series Indicators】
This is a video showing the backtest of the indicator for last week (March 23–27, 2020).
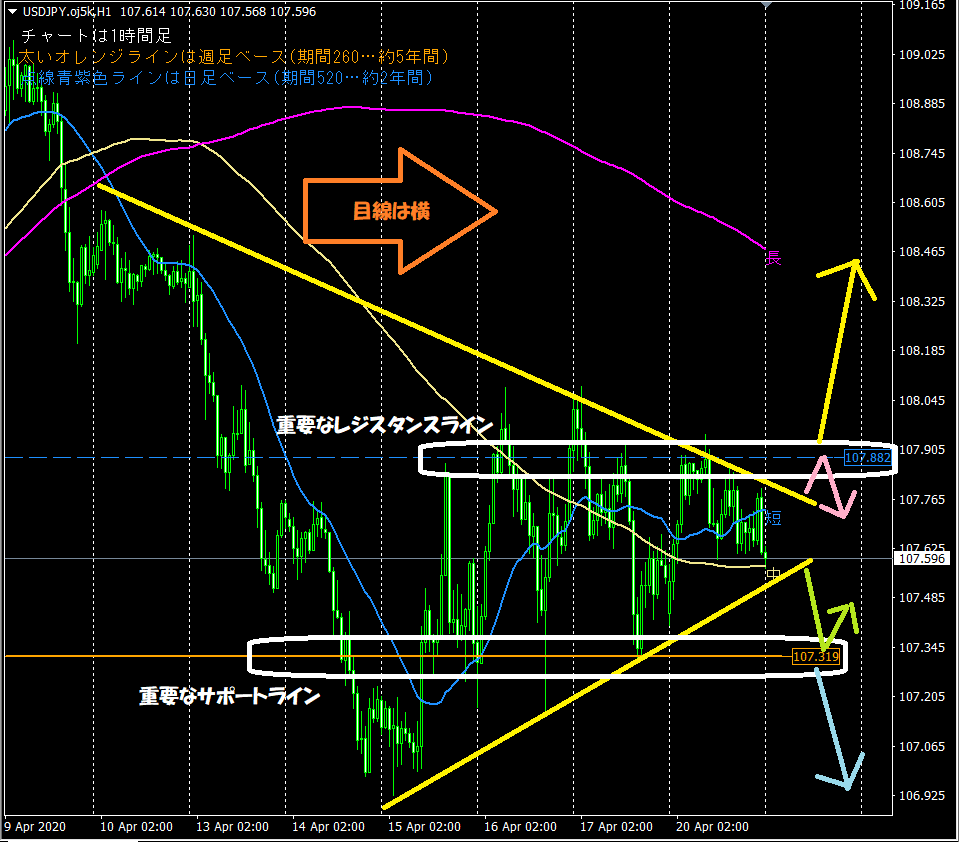
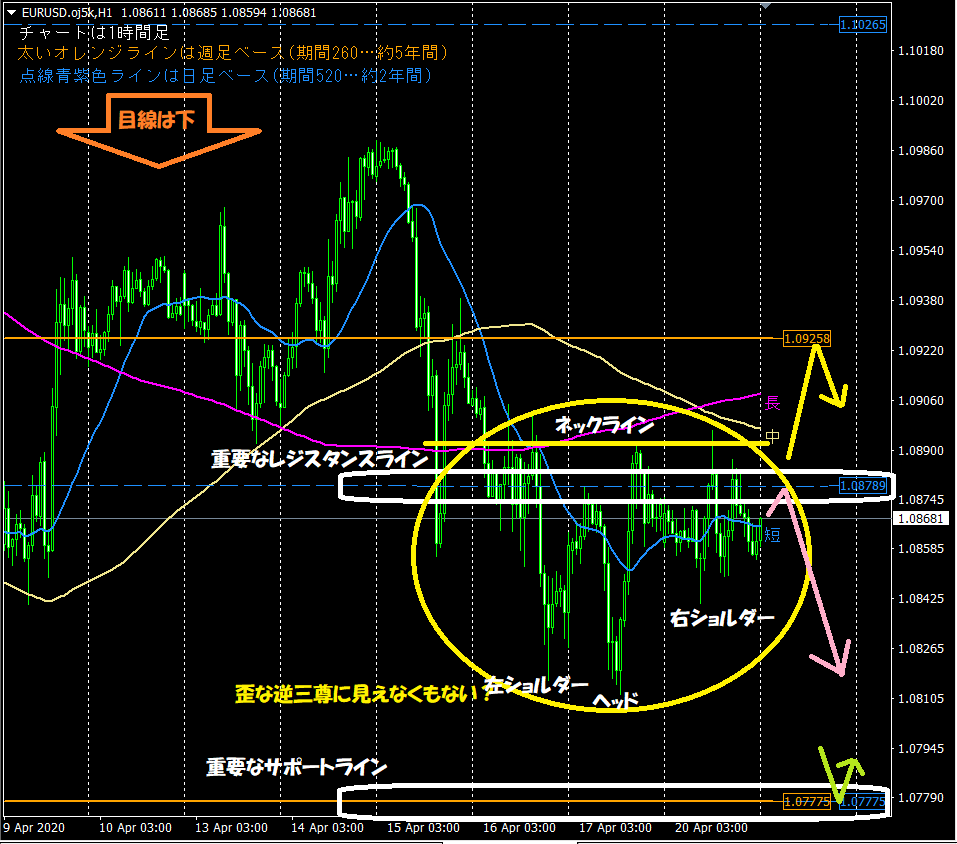
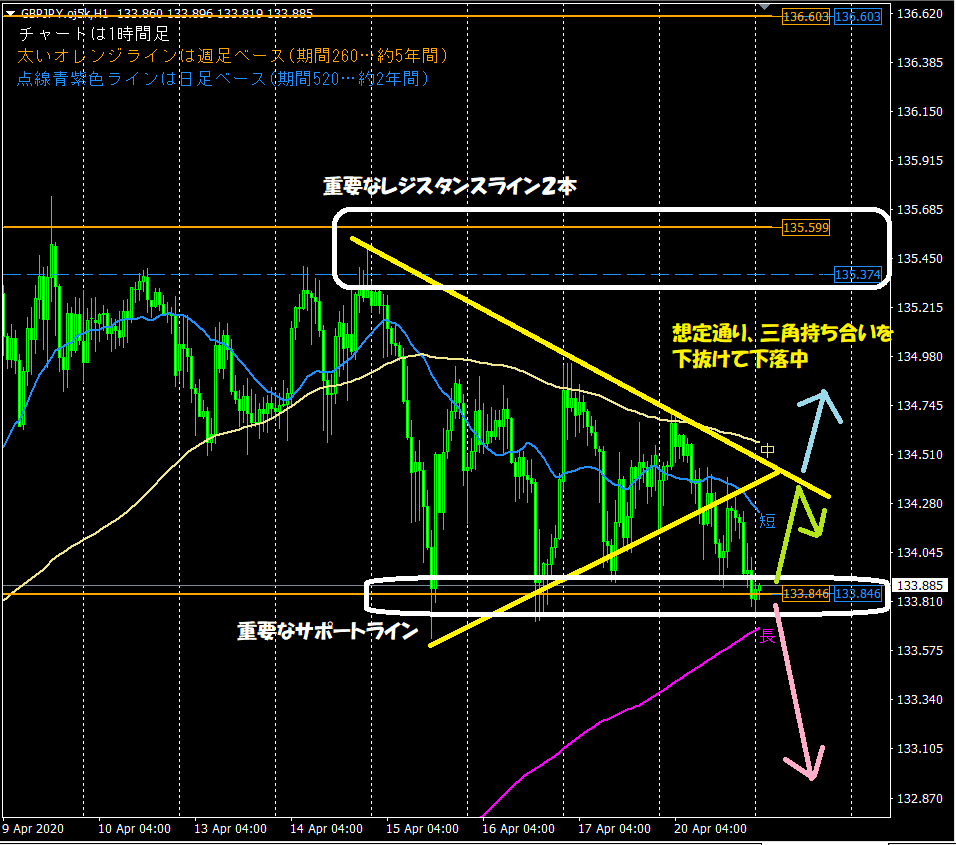
This is the hourly chart used in the blog’s chart analysis every morning. The two points to look at are below.1. The horizontal lines auto-displayed by the indicator act as support/resistance
⇒ Thick orange line (weekly basis, period 260… 5 years), purple dashed line (daily basis, period 520… 2 years)
2. The moving averages optimized for the hourly chart are often observed
⇒ Particularly the short-term line (period 24… 1 day) and the long-term line (period 480… 1 month)
【Introducing the product for sale: ‘Koroppokuru ~ Auto Display Horizontal Lines ~’】
The indicators used in market analysis were designed to automatically display horizontal lines to reduce trading effort. They were created with that aim in mind.
They analyze the highest and lowest prices within a set period by price band and automatically display up to three optimal horizontal lines across up to three timeframes.。
Highly recommended for busy professionals and homemakers.
If you want to buy or are just curious, please go to the product page from the link below!
<<<Koroppokuru ~ Auto Display Horizontal Lines ~>>>

【Introducing the product: ‘Koroppokuru ~ Triple Display of Moving Averages ~’】
The moving averages used in market analysis are now shown with the newly released indicator “Koroppokuru ~ Triple Display of Moving Averages ~”.
This indicator is intended for those who are unsure about how to introduce or use moving averages in their analysis.
If you practice or study market analysis and trading for FX or stocks, have you ever considered introducing moving averages?
If so, you may have had concerns like the following:
・You tried moving averages but can’t determine the best parameter values. Especially the ‘period’.
・You added too many moving averages and aren’t sure what’s correct… you want to reset the excess setup!
・Some sites show 1 moving average, others show 5— which is right?
・You tried applying moving averages in your own way but feel unsure if it’s correct.
This indicator solves all those concerns!
If you want to buy or are just curious, please go to the product page from the link below!
<<<Koroppokuru ~ Triple Display of Moving Averages ~>>>

We are also active on Twitter, so please follow us!
<< Yururi-mo Yururi Twitter >>

【Lastly】
Thank you for reading this blog until the end!
I hope it helps with your asset management.