[Dollar/Yen/Euro-Dollar/Pound-Yen] Market analysis for Monday, April 20, 2020
【USD/JPY / EUR/USD / GBP/JPY】Market analysis for Monday, April 20, 2020
Good morning, everyone! This is Yururi mo Yururi.
Thank you very much for visiting this blog.
On April 20, 2020 (Monday)we updated the blog with market analysis.
About the three currency pairs: USD/JPY, EUR/USD, GBP/JPYwe have written.
Please have a look!
<<【USD/JPY / EUR/USD / GBP/JPY】Market analysis for April 20, 2020 (Mon)>>

We have released a new indicator “Koropokkuru~ Angle is King Series~”!
An indicator that displays signals emphasizing the angles of MACD and OsMA.
A reliability-focused “Standard” version and a quick-detection-focused “Early” version are available.
Please take a look!
<<【All 4 Types Best Set】 Koropokkuru~ Angle is King Series ~>>
We have published backtest results for the indicators.

We also publish results for other currency pairs and timeframes, so please refer to them.
<<Koropokkuru~ Angle is King Series~ Standard/Early Version Results>>
This week's market analysis is also on the blog. If you haven't read it yet, please take a look.
<<【USD/JPY / EUR/USD / GBP/JPY】 Market analysis from Apr 20 to Apr 24, 2020>>
【Backtest of Koropokkuru Series Indicators】
This is a video showing backtesting of the indicator for last week (Mar 23–27, 2020).
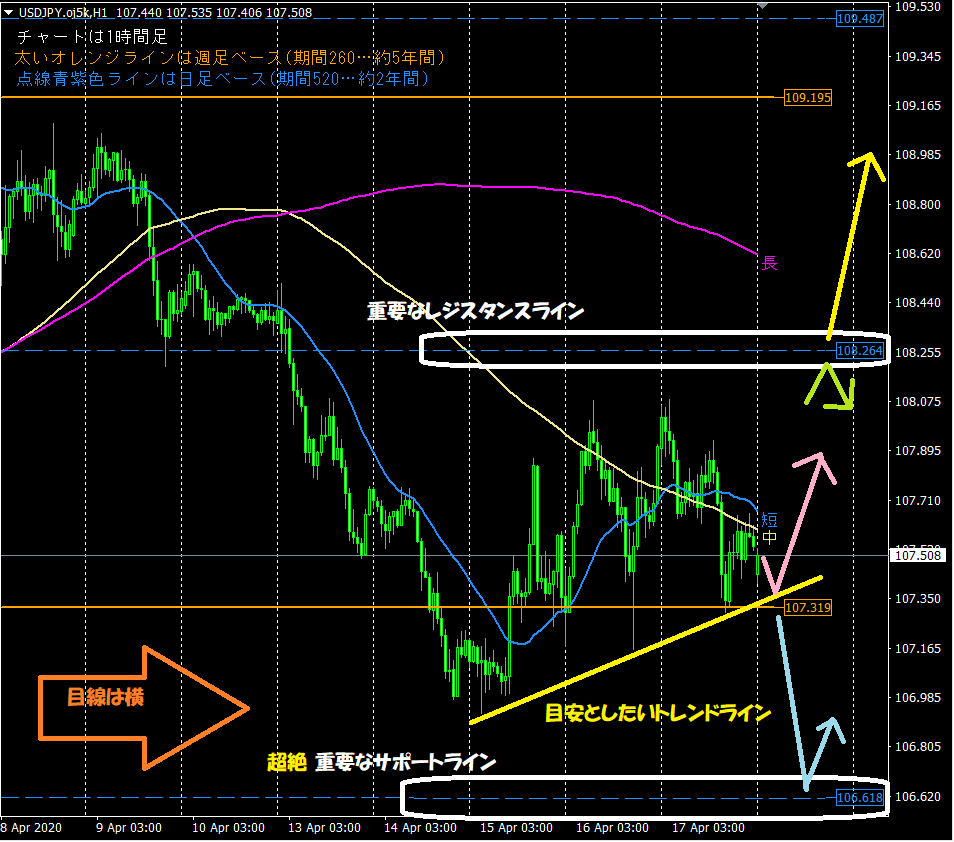
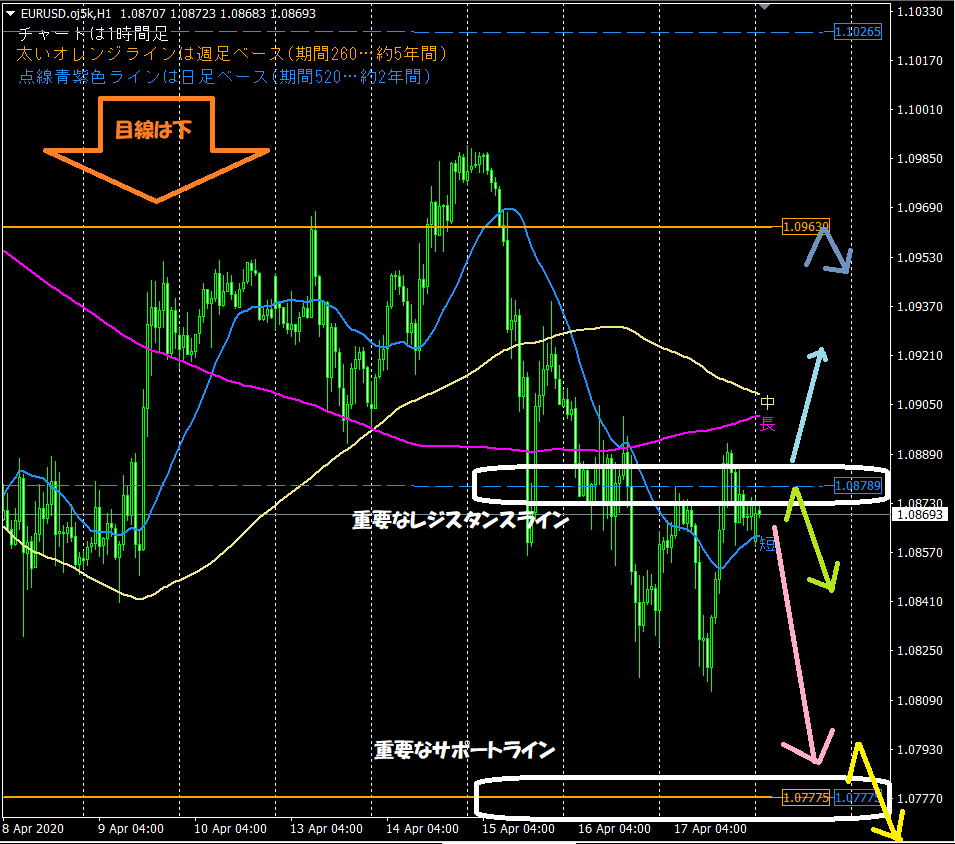
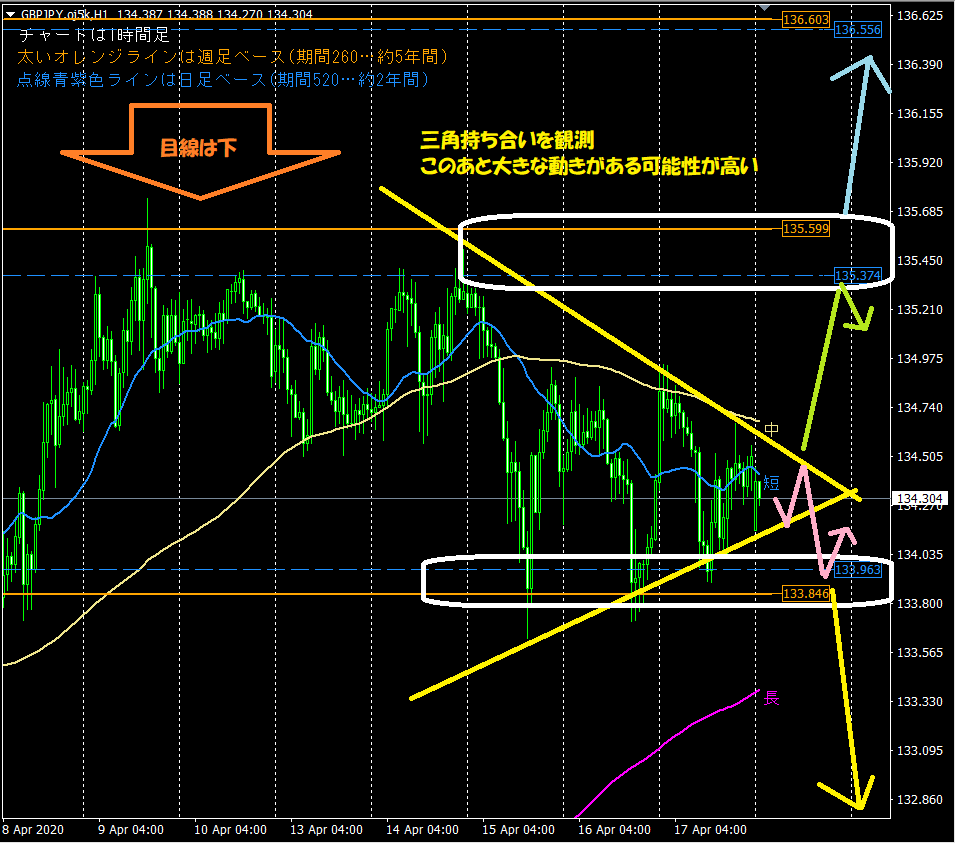
This is the hourly chart used in the blog's chart analysis every morning. Key points to look at are two:1. The horizontal lines automatically displayed by the indicator function as support/resistance
⇒ Thick orange line (weekly base, period 260… 5 years), purple dashed line (daily base, period 520… 2 years)
2. Moving averages optimized for the 1-hour chart are often respected
⇒ Especially the short-term line (period 24… 1 day) and the long-term line (period 480… 1 month)
【Product featured: ‘Koropokkuru~ Automatically Displays Horizontal Lines ~’】
The indicators used for market analysis automatically display horizontal lines to ease trading workload and were designed for this purpose. .
They analyze the highest and lowest prices within a set period by price band and automatically display up to three optimal horizontal lines across three timeframes.
Highly recommended for busy professionals and homemakers.
If you want to purchase or are interested, please go to the product page via the link below!
<<<Koropokkuru~ Automatically Displays Horizontal Lines ~>>>

【Introduction to the product 'Koropokkuru~ Triple Display Moving Averages ~' is now on sale】
The moving averages used in market analysis are displayed by the newly released indicator“Koropokkuru~ Triple Display Moving Averages ~”
This indicator is designed for those who are 고민ing about the introduction and usage of moving averages.
For those practicing or studying market analysis and trading in FX or stocks, have you ever considered introducing moving averages?
If so, you may have had concerns like the following
• You introduced moving averages but don’t know the best values to set for parameters, especially the ‘period’.
• Added too many moving averages and lost sight of what’s correct… want to reset the overabundance!
• Depending on the reference site, there is either one moving average or five; which is correct?
• You implemented moving averages in your own way but worry if it’s correct.
Our indicator solves all such worries!
If you want to purchase or are curious, please go to the product page via the link below!
<<<Koropokkuru~ Triple Display Moving Averages ~>>>

We are also active on Twitter, so please follow us!
<< Yururi mo Yururi’s Twitter >>

【Finally】
Thank you for reading this blog until the end!
We hope it assists with your asset management.