
【FX full-time trader cat's GBP/JPY trade analysis 0416】
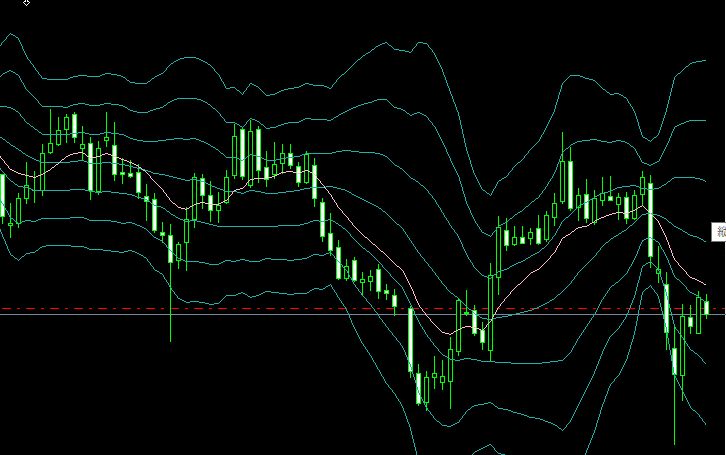
The GBP/JPY bounced at the daily middle band.
The photo shows my main business short position.
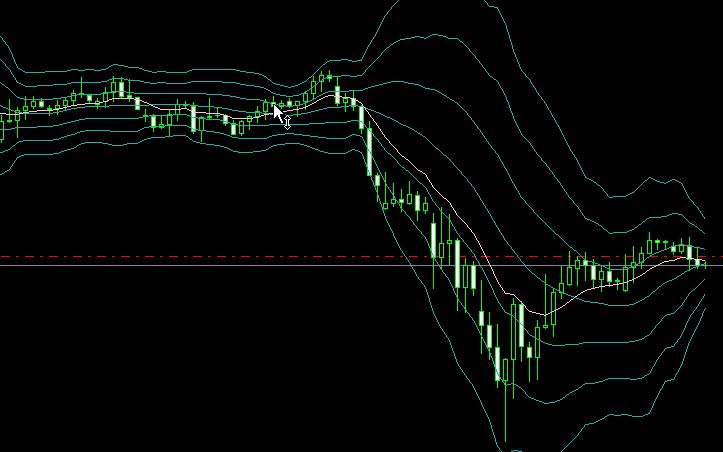
However, assuming we would test lower again, I turned on the N-Method EA entry and entered. This entry was made at a better position. At 6 AM, N-Method's take-profit signal appeared, about 50 PIPs. The volatility is low. That's why the daily chart is in a squeeze.
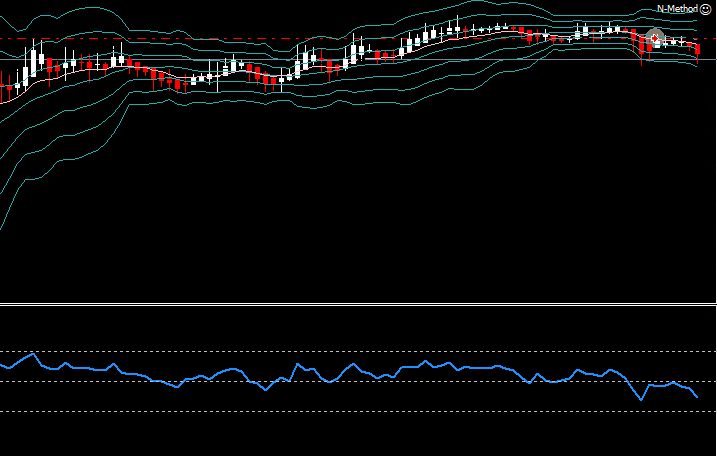
The RSI was also held at 50.
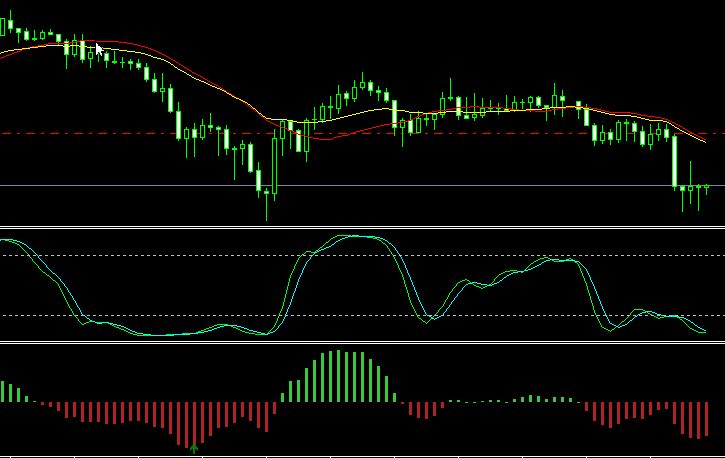
This is my entry, but you can also enter from here with N-Method discretionary entry. Even with a dead-cross MACD histogram, whether it’s a bullish or bearish candlestick with a higher shadow, I enter while watching the direction of the higher timeframe. The moving averages are downward-sloping and the price is below them, so it’s bearish.
Let’s also look at the weekly chart.
It was held by the downside resistance line at -1 standard deviation. The monthly chart is
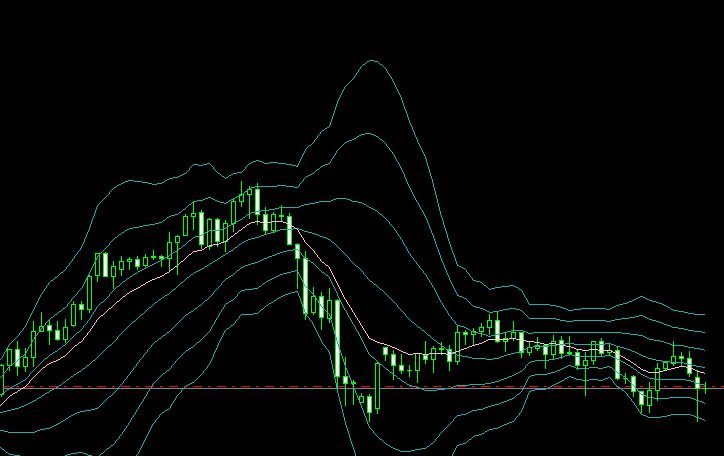
The middle band is downward-sloping and the price is below it, so bearish. From the chart, at least it is not yet “like the Lehman Shock.”
My “predictions” are often wrong, so I always lean toward the contrarians (laugh). When I start predicting, I always doubt it and try to think of the opposite action.