[USD/JPY / EURUSD / GBPJPY] Market analysis for Friday, April 17, 2020
【Dollar/Yen/Euro/Yen/ Pound/Yen】Market Analysis for Friday, April 17, 2020
Good morning, everyone! This is Yururi mo Yururi.
Thank you very much for visiting this blog.
On Friday, April 17, 2020I updated a blog post about market analysis.
The three currency pairs: Dollar/Yen, Euro/Yen, Pound/Yenare covered in this article.
Please take a look!
<<【Dollar/Yen/Euro/Yen/Pound/Yen】Market Analysis for Friday, April 17, 2020>>

We have started selling a new indicator titled “Koropokkuru – Angle is King Series”!
An indicator that displays signals that emphasize angles of MACD and OsMA.
The Reliable ‘Standard’ Version, and the Early Detection–focused ‘Early’ Version are available.
Please take a look!
<<【All 4 Types Best Set】Koropokkuru – Angle is King Series>>
We have published backtest results of the indicators.

We also publish analyses for other currency pairs and timeframes, so please refer to them.
<<Koropokkuru – Angle is King Series – Standard Version Early Version Backtest Results>>
I have also written this week’s market analysis on the blog. If you haven’t read it yet, please take a look.
<<【Dollar/Yen/Euro/Yen/Pound/Yen】Market Analysis for April 13–April 17, 2020>>
【Backtest of Koropokkuru Series Indicators】
This is a video of backtesting the indicator for last week (March 23–27, 2020).
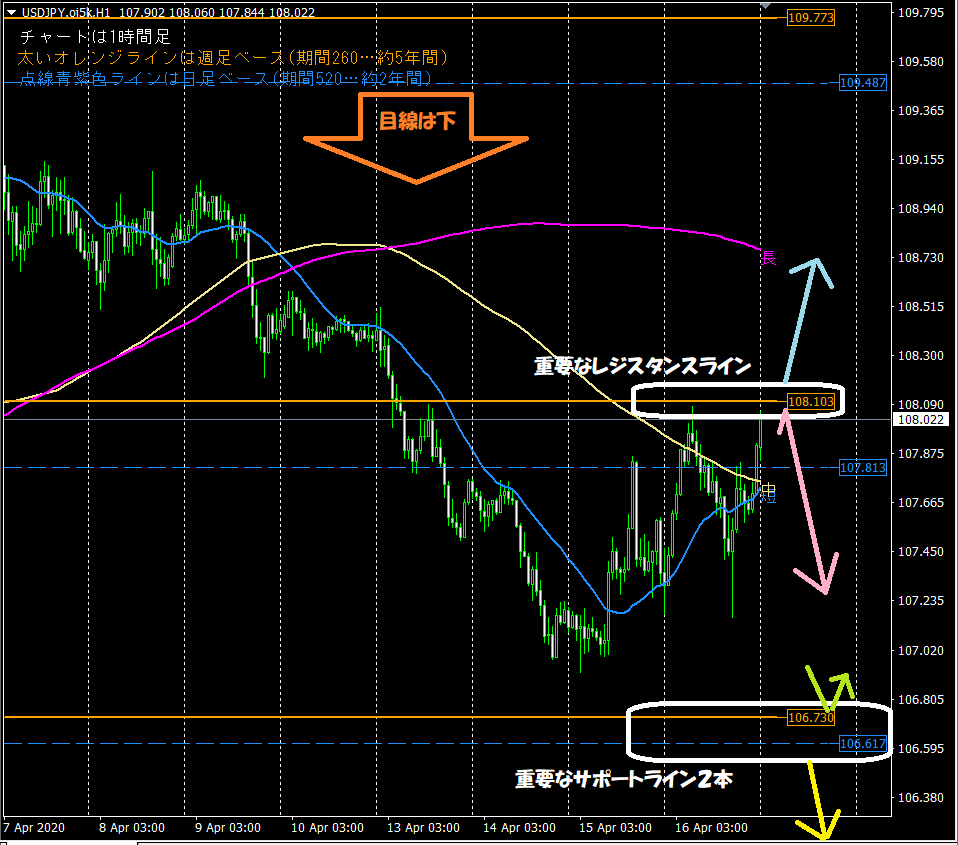
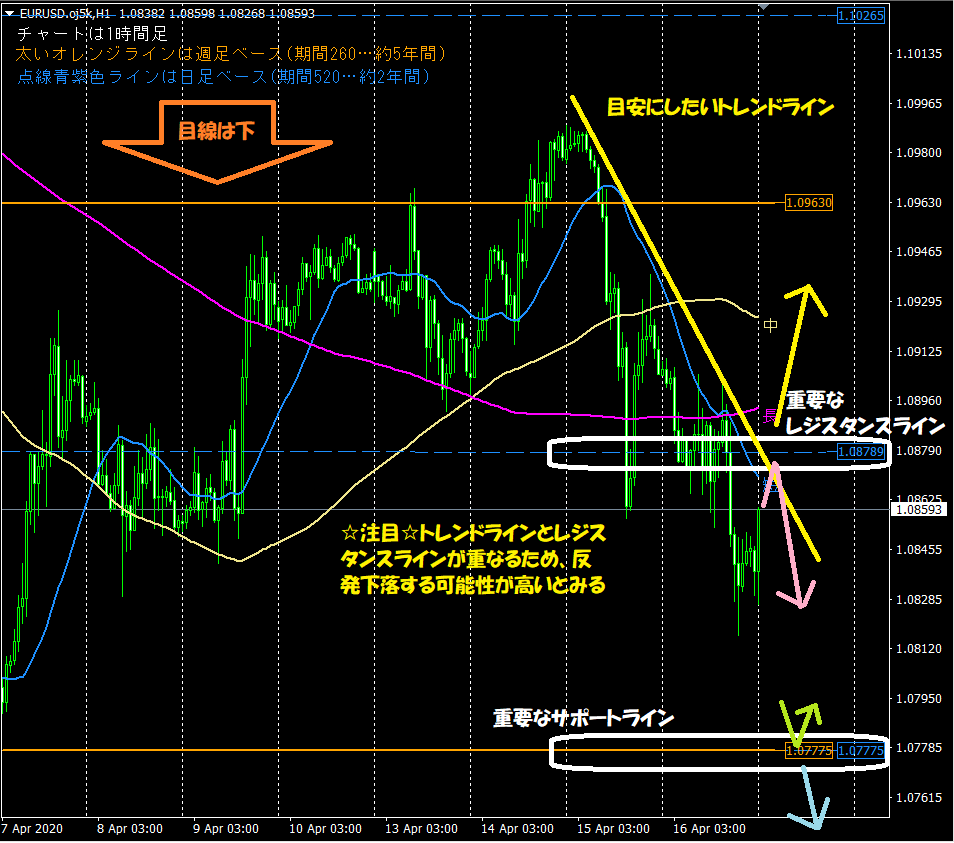
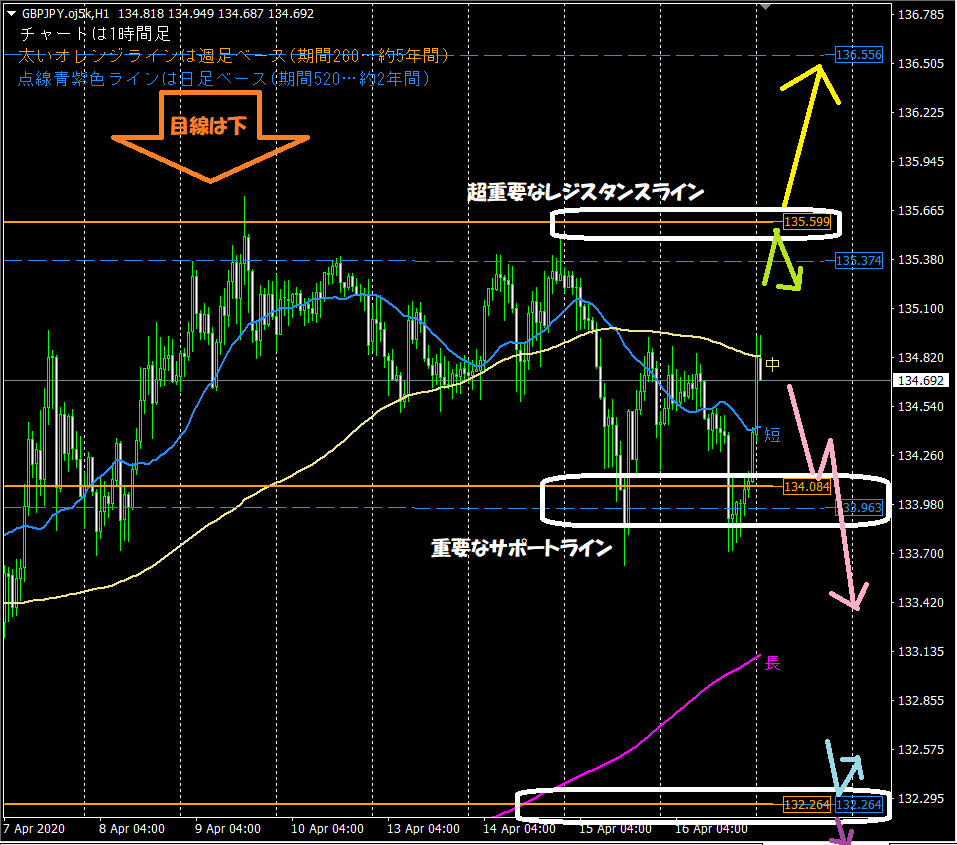
This is a one-hour chart I use in the blog’s daily chart analysis every morning. Important points to note are the following two items.1. The horizontal lines automatically displayed by the indicator function as support/resistance
⇒ The thick orange line (weekly basis, period 260… 5 years), the purple dashed line (daily basis, period 520… 2 years)
2. The moving averages optimized for the one-hour chart are often respected
⇒ Especially the short-term line (period 24… 1 day) and the long-term line (period 480… 1 month)
【Introducing the For-Sale Item ‘Koropokkuru – Automatic Horizontal Lines’】
The indicators used for market analysis are designed to automatically display horizontal lines to reduce trading burden. The goal is to automatically display up to three optimal horizontal lines across up to three timeframes..
It analyzes the highest and lowest prices within a set period by price band, displaying the most suitable horizontal lines automatically across up to three timeframes.
I highly recommend it for busy professionals and homemakers.
If you want to buy or are a little interested, please go to the product page from the link below!
<<<Koropokkuru – Automatic Horizontal Lines>>>

【Introducing the On-Sale Item ‘Koropokkuru – Triple Moving Averages’】
The moving averages used for market analysis are displayed with the newly released indicator “Koropokkuru – Triple Moving Averages”!
This indicator is for those who are puzzled about how to introduce and use moving averages.
For those who practice or study FX or stock market analysis and trading, have you ever considered adopting moving averages?
If so, you may have had concerns like the following.
・Tried moving averages but don’t know the optimal values to set for parameters, especially the “Period.”
・Inserted too many moving averages and lost clarity… want to reset the excessive setup!
・Some sites show only one moving average, others five— which is correct?
・Tried to customize moving averages but aren’t sure if it’s right.
This indicator solves all those concerns!
If you want to buy or are a little interested, please go to the product page from the link below!
<<<Koropokkuru – Triple Moving Averages>>>

I’m also active on Twitter, so please give me a follow!
<<Yururi mo Yururi on Twitter>>

【Finally】
Thank you for reading this blog until the end!
I hope it helps with everyone’s asset management.