【Dollar/Yen/Euro/Dollar】Market analysis for Thursday, April 16, 2020
【USD/JPY, EUR/USD, GBP/JPY】 Market Analysis for Thursday, April 16, 2020
Good morning, everyone! This is Yururi mo Yururi.
Thank you very much for visiting this blog.
We have updated a blog post on the market analysis forThursday, April 16, 2020.
The three currency pairs USD/JPY, EUR/USD, GBP/JPYare described.
Please take a look!
<<【USD/JPY, EUR/USD, GBP/JPY】 Market Analysis for Thursday, April 16, 2020>>

We have launched a new indicator “Koropokkuru ~ Angles Are Life Series ~”!
An indicator that highlights signals emphasizing the angle of MACD and OsMA.
The 'Standard' version focusing on reliability, and the 'Early' version focusing on early detection are available.
Please take a look!
<<【All 4 Types Best Set】 Koropokkuru ~ Angles Are Life Series ~ >>
We have published backtest results of the indicator.

Other currency pairs and timeframes are also published, so please refer to them.
<<Koropokkuru ~ Angles Are Life Series ~ Standard Early Backtest Results>>
This week's market analysis is also written on the blog. If you haven't read it yet, please take a look.
<<【USD/JPY, EUR/USD, GBP/JPY】 Market Analysis for April 13–17, 2020>>
【Backtest for Koropokkuru Series Indicator】
This is a video showing the backtest of the indicator for last week (March 23–27, 2020).
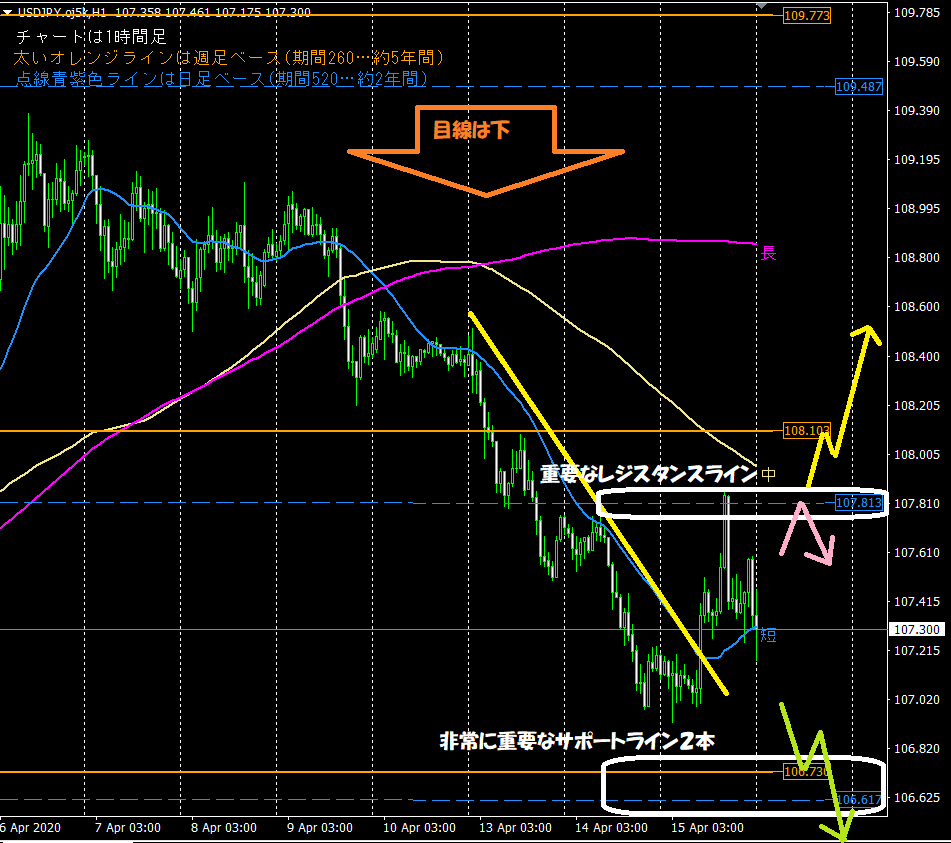
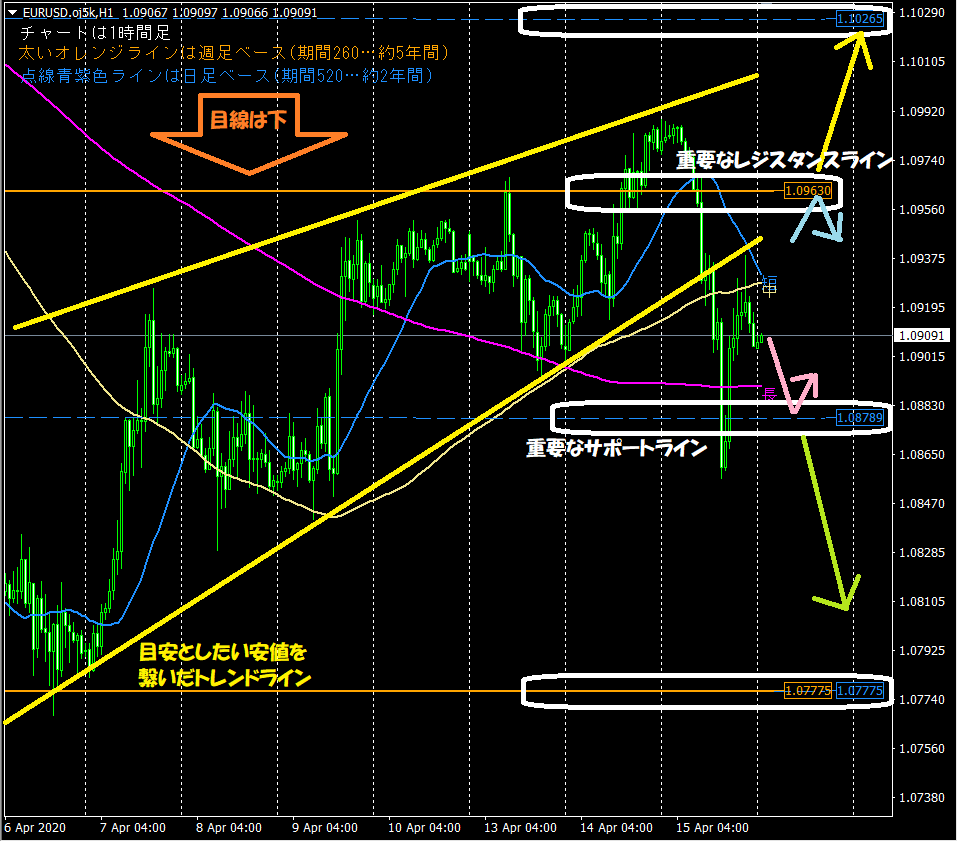
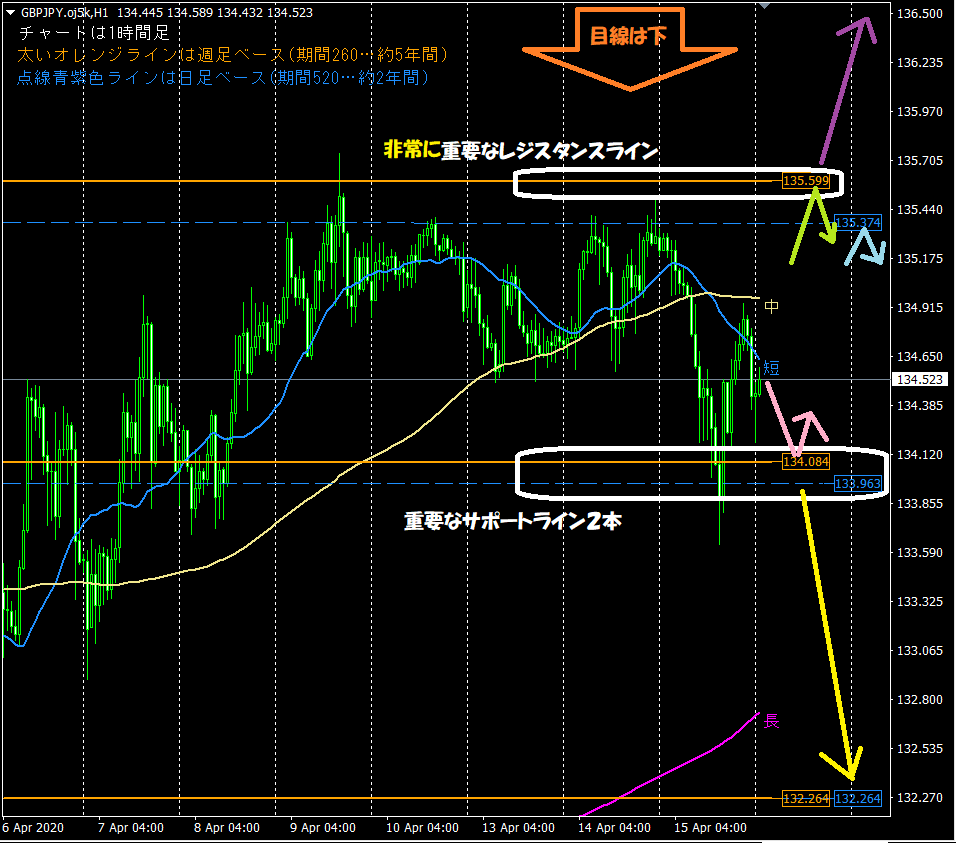
This is the 1-hour chart used in the blog’s chart analysis every morning. The two key points to look at are below.1. The horizontal lines automatically displayed by the indicator are functioning as support/resistance
⇒ Thick orange line (weekly basis, period 260… 5 years), purple dashed line (daily basis, period 520… 2 years)
2. Moving averages optimized for the 1-hour chart are often respected
⇒ Especially the short-term line (period 24… 1 day) and the long-term line (period 480… 1 month)
【Product for sale: ‘Koropokkuru ~ Automatic Horizontal Line Display ~’ Introduction】
The indicator used in market analysis automatically displays horizontal lines to reduce trading effort and was created with that goal in mind..
Analyzes the highest and lowest values within a set period by price range and automatically displays the optimal horizontal lines for up to three timeframes.
Highly recommended for busy office workers and housewives.
If you want to buy or if you’re just curious, please go to the product page from the link below!
<<<Koropokkuru ~ Automatic Horizontal Line Display ~>>>

【Introduction to the product: ‘Koropokkuru ~ Triple Display of Moving Averages ~’】
The moving averages used in market analysis are displayed by the newly released indicator “Koropokkuru ~ Triple Display of Moving Averages ~”.
This indicator is for those who are unsure about introducing moving averages or how to use them.
Has anyone who studies or trades FX or stocks considered introducing moving averages?
If so, you may have had concerns like the following.
・Tried moving averages but can’t determine the best values to set for parameters, especially ‘Period’.
・Introduced too many moving averages and lost sight of what is correct… want to reset from overuse!
・Sites you reference show 1, 5, or different numbers of moving averages, which is correct?
・Tried to customize moving averages but worry if it’s correct.
This indicator can solve all those worries!
If you want to buy or if you’re just curious, please go to the product page from the link below!
<<<Koropokkuru ~ Triple Display of Moving Averages ~>>>

We are also active on Twitter, so please follow us!
<< Yururi mo Yururi Twitter >>

【Lastly】
Thank you for reading this blog until the end!
We hope it helps with your asset management.