【Dollar/Yen/Euro/Dollar】Market analysis for Wednesday, April 15, 2020
【USD/JPY, EUR/USD, GBP/JPY】 Market Analysis for Wednesday, April 15, 2020
Good morning everyone! This is Yururi mo Yururi.
Thank you very much for visiting this blog.
I updated a blog post on the market analysis forWednesday, April 15, 2020.
Three currency pairs: USD/JPY, EUR/USD, GBP/JPY are covered.
Please take a look!
<<【USD/JPY, EUR/USD, GBP/JPY】 Market Analysis for April 15, 2020>>

We have started selling a new indicator 'Koropokkuru - Angle is Law Series'!
An indicator that displays signals with a focus on the angles of MACD and OsMA
The 'Standard' version for reliability, and the 'Early' version for early detection are available.
Please take a look!
<<【All 4 Types Best Set】 Koropokkuru - Angle is Law Series>>
We have公開ed the results of backtests for the indicators.

We have published analyses for other currency pairs and timeframes, so please refer to them.
<<Koropokkuru - Angle is Law Series - Standard, Early backtest results>>

I also wrote about this week's market analysis on the blog. If you haven't read it yet, please take a look.
<<【USD/JPY, EUR/USD, GBP/JPY】 Market Analysis for April 13-17, 2020>>
【Backtest of Koropokkuru Series Indicators】
This is a video showing backtest results for the indicator for last week (March 23–27, 2020).
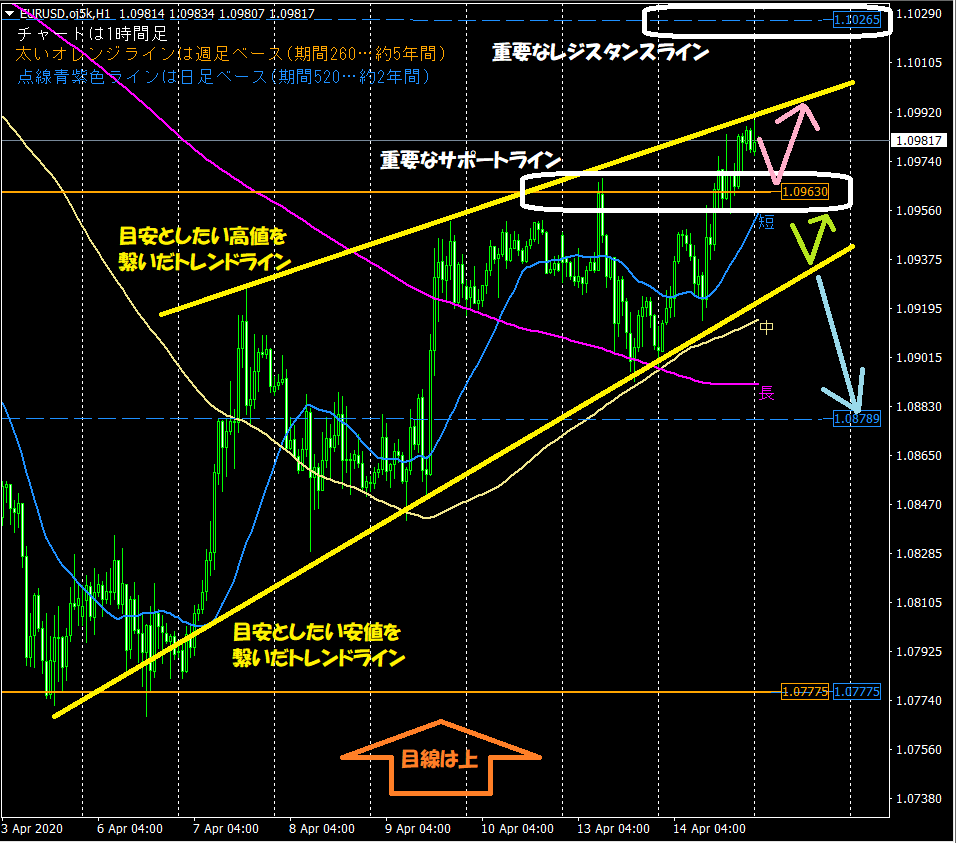
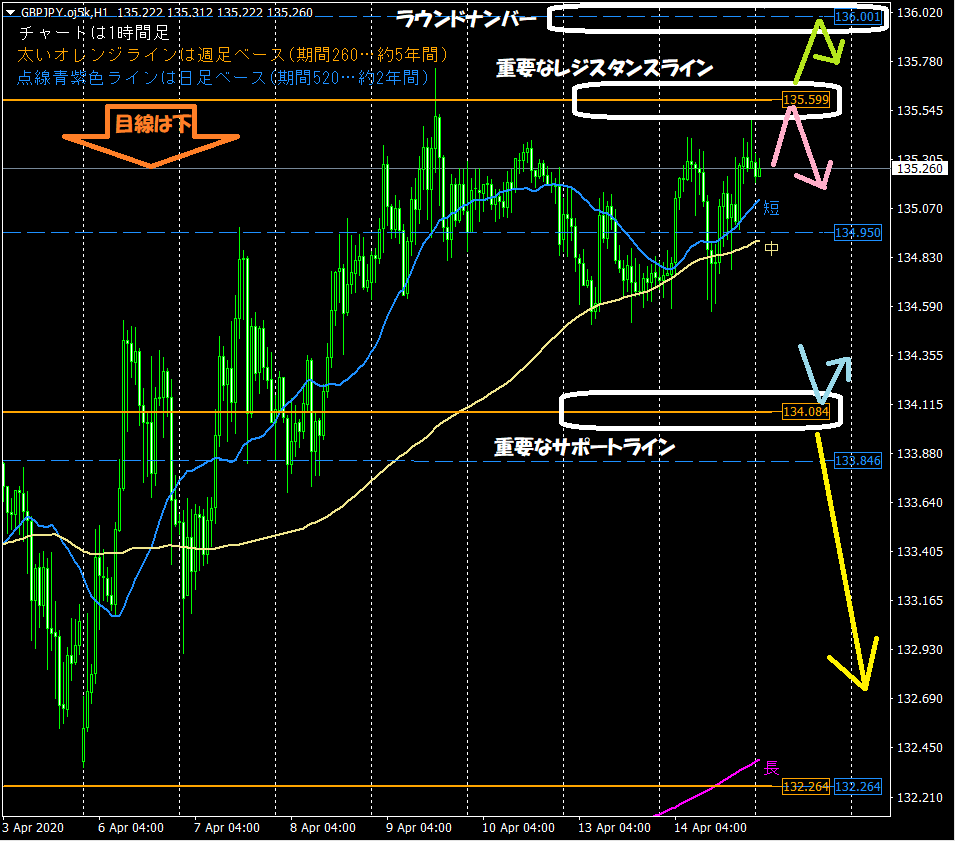
This is the hourly chart used in the blog's chart analysis every morning. The two points to note are below.1. The horizontal lines auto-displayed by the indicator function as support/resistance
⇒ The thick orange line (weekly basis, period 260… 5 years), purple dashed line (daily basis, period 520… 2 years)
2. Moving averages optimized for the 1-hour chart are frequently respected
⇒ Especially the short-term line (period 24… 1 day) and the long-term line (period 480… 1 month)
【Product for sale: 'Koropokkuru - Auto Display Horizontal Lines'】
The indicators used in market analysis are designed to automatically display horizontal lines to reduce trading effort.
They analyze the highest and lowest prices within a set period by price band and automatically display up to three optimal horizontal lines across three timeframes.。
Highly recommended for busy professionals and housewives.
If you are interested in purchasing or want to learn more, please go to the product page via the link below!
<<<Koropokkuru - Auto Display Horizontal Lines>>>

【Introduction to another product 'Koropokkuru - Triple Display Moving Averages'】
The moving averages used in market analysis are displayed with the newly released indicator "Koropokkuru - Triple Display Moving Averages".
This indicator is aimed at those who are puzzled about introducing and using moving averages.
For those doing FX, stock market analysis, or trading, have you ever considered incorporating moving averages?
If so, you may have had concerns like the following.
・Tried moving averages but cannot determine the best values to set for parameters, especially 'period'.
・Put in too many moving averages and lost track of what is correct… want to reset from overuse.
・On various reference sites there is one moving average or five — which is correct?
・Tried implementing moving averages in your own way but unsure if it is correct.
This indicator solves all those concerns!
If you want to purchase or just be curious, please go to the product page via the link below!
<<<Koropokkuru - Triple Display Moving Averages>>>

We are also active on Twitter, so please follow us!
<< Yururi mo Yururi's Twitter >>

【In Conclusion】
Thank you for reading this blog until the end!
I hope it helps with your asset management.