【USD/JPY / EUR/USD / GBP/JPY】Market analysis for Tuesday, April 14, 2020
【USD/JPY/EUR/USD/GBP/JPY】Market analysis for Tuesday, April 14, 2020
Good morning, everyone! This is Yururi mo Yururi.
Thank you very much for visiting this blog.
On Tuesday, April 14, 2020I updated the blog about the market analysis.
Three currency pairs: USD/JPY, EUR/USD, GBP/JPYare discussed.
Please take a look!
<<【USD/JPY/EUR/USD/GBP/JPY】Market analysis for Tuesday, April 14, 2020>>

We have started selling the new indicator “Koropokkuru ~ Angle is Life Series ~”!
An indicator that displays signals emphasizing the angles of MACD and OsMA.
The “Standard” version for reliability, and the “Early” version for early detection are prepared.
Please take a look!
<<【All 4 Types Best Set】Koropokkuru ~ Angle is Life Series ~>>
We have published backtest results for the indicators.

We also publish other currency pairs and timeframes, so please refer to them.
<<Koropokkuru ~ Angle is Life Series ~ Standard Early Backtest Results>>

This week’s market analysis is also on the blog. If you haven’t read it yet, please take a look.
<<【USD/JPY/EUR/USD/GBP/JPY】Market analysis for April 13~17, 2020>>
【Backtest of Koropokkuru Series indicators】
This is a video showing backtesting the indicator for last week (March 23–27, 2020).
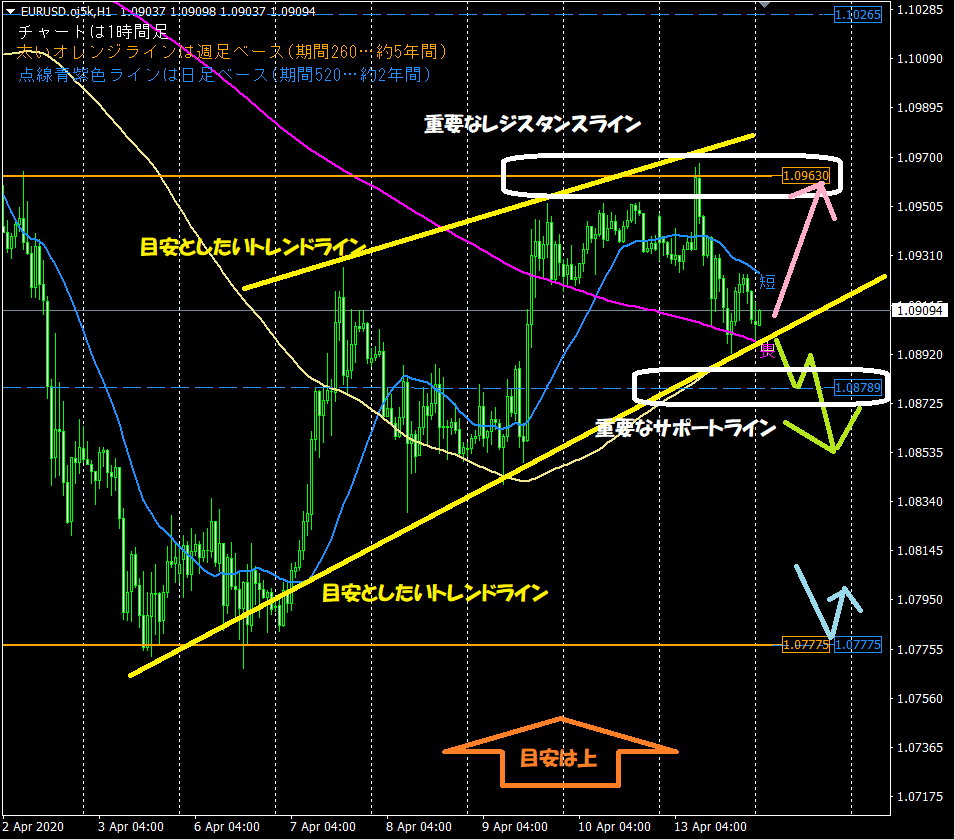
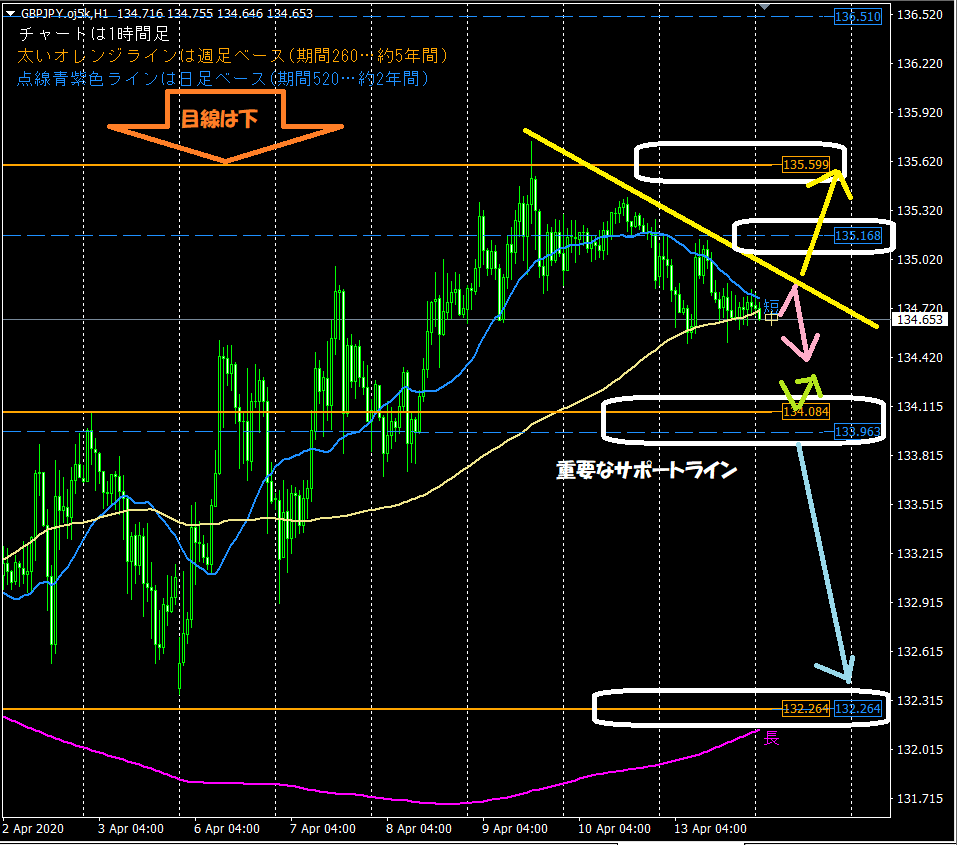
This is the hourly chart used in the blog’s morning chart analyses. Key points to look at are two things:1. The horizontal lines automatically displayed by the indicator are functioning as support/resistance
⇒ Thick orange line (weekly basis 260 period… 5 years), purple dashed line (daily basis 520 period… 2 years)
2. The moving averages optimized for the 1-hour chart are often relevant
⇒ Especially the short-term line (period 24… 1 day) and the long-term line (period 480… 1 month)
【Product for sale: ‘Koropokkuru ~ Auto Horizontal Line Display ~’ Introduction】
The indicators used for market analysis are designed to automatically display horizontal lines to reduce trading workload.They analyze the highest and lowest within a set period by price range and automatically display up to three optimal horizontal lines across up to three timeframes.
Recommended for busy professionals and housewives.
If you’re interested, please click the links below to view the product page!
<<<Koropokkuru ~ Auto Horizontal Line Display ~>>>

【Product for sale: ‘Koropokkuru ~ Triple Display of Moving Averages ~’ Introduction】
The moving averages used in market analysis are displayed by the newly released indicator “Koropokkuru ~ Triple Display of Moving Averages ~”!
This indicator is intended for those who are troubled with introducing or using moving averages.
Have you ever analyzed FX or stocks and then thought about introducing moving averages?
In such cases,you may have had concerns like the following.
・Tried using moving averages but don’t know the best values to set for parameters, especially the “period”.
・Introduced too many moving averages and lost track of what is correct… want to reset the overabundance.
・Some sites show one moving average while others show five, which is correct?
・Tried implementing moving averages in your own way but feel uncertain about correctness.
This indicator solves all of those concerns!
If you’re interested, please click the links below to view the product page!
<<<Koropokkuru ~ Triple Display of Moving Averages ~>>>

We are active on Twitter as well, so please follow us!
<< Yururi mo Yururi Twitter >>

【Finally】
Thank you for reading this blog until the end!
We hope it helps with your asset management.