【Dollar/Yen/Euro/Dollar】Market analysis for Monday, April 13, 2020
【USD/JPY/EUR/USD/GBPJPY】Market Analysis for Monday, April 13, 2020
Good morning, everyone! This is Yururi mo Yururi.
Thank you very much for visiting this blog.
On Monday, April 13, 2020I updated the market analysis in this blog.
Three currency pairs: Dollar/Yen, Euro/Dollar, and Pound/Yenare written about.
Please take a look!
<<【USD/JPY/EUR/USD/GBPJPY】Market Analysis for Monday, April 13, 2020>>

We have released a new indicator ‘Koropokkuru~Angle is Key Series~’!
An indicator that displays signals that emphasize angles of MACD and OsMA.
Reliable “Standard Version” and “Early Detection Version” are available.
Please have a look sometime!
<<【All 4 Types Ultimate Set】Koropokkuru~Angle is Key Series~>>
We have published backtest results of the indicators.

We also publish other currency pairs and timeframes for reference, so please take a look.
<<Koropokkuru~Angle is Key Series~ Standard Version Early Version Backtest Results>>

I also write about this week's market analysis on the blog. If you haven't read it yet, please take a look.
<<【USD/JPY/EUR/USD/GBPJPY】Market Analysis for Apr 13–17, 2020>>
【Backtest of Koropokkuru Series Indicators】
This is a video of backtesting the indicators for the previous week (Mar 23–27, 2020).
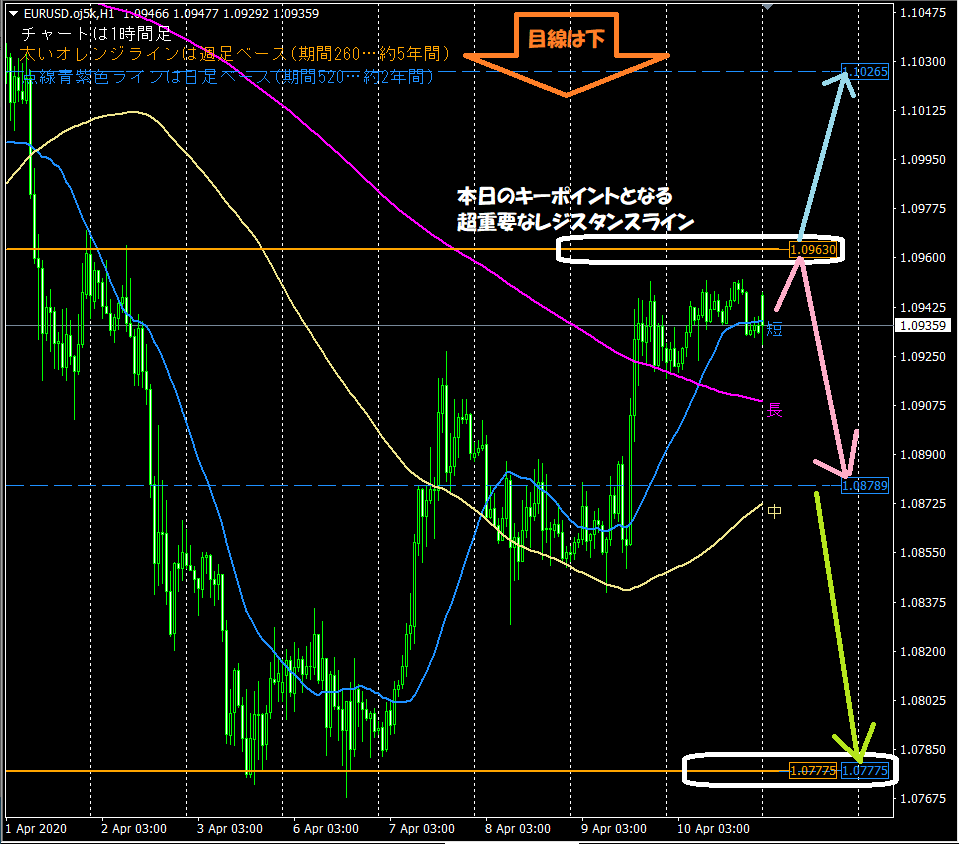
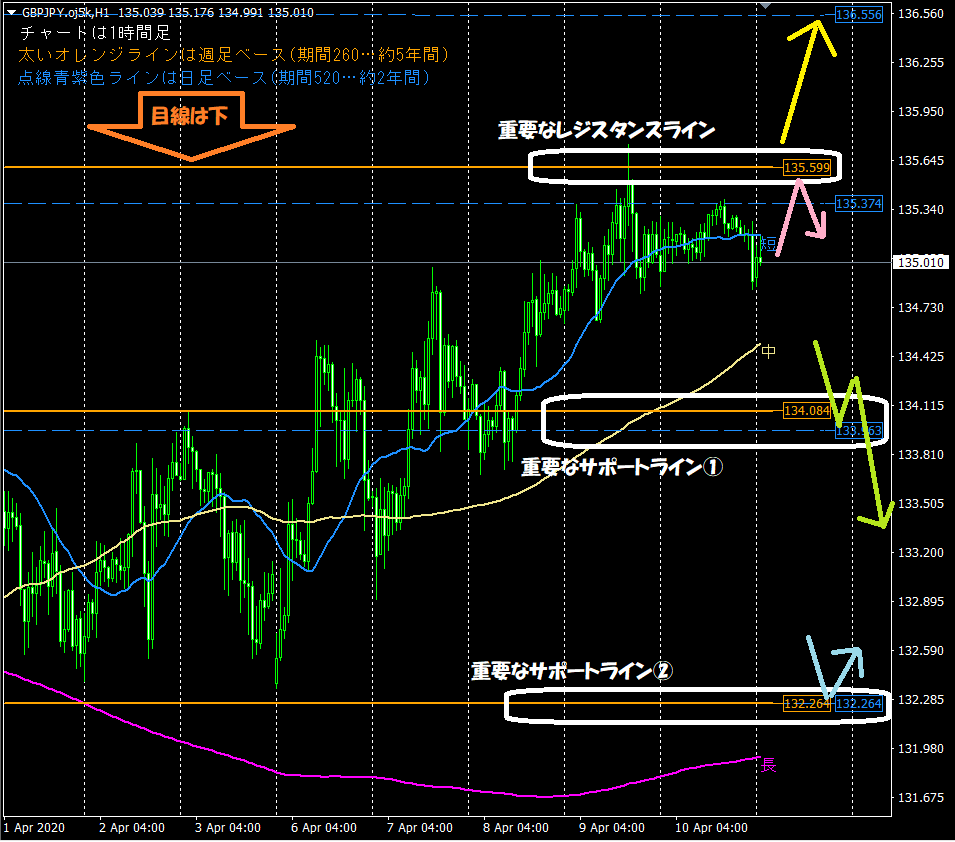
This is the hourly chart used in the blog's morning chart analysis. Key points to watch are two items below.1. The horizontal lines automatically displayed by the indicators are functioning as support/resistance
⇒ Thick orange line (weekly basis, period 260... 5 years), purple dashed line (daily basis, period 520... 2 years)
2. The moving averages optimized for the 1-hour chart are often respected
⇒ Especially the short-term line (period 24... 1 day) and the long-term line (period 480... 1 month)
【Product on sale: ‘Koropokkuru~Automatic Horizontal Lines~’ Introduction】
The indicators I use for market analysis automatically display horizontal lines to reduce trading burden and were designed for this purpose. .
They analyze the highest and lowest prices within the chosen period by price range and automatically display up to three optimal horizontal lines on each of three timeframes.。
Highly recommended for busy professionals and homemakers.
If you want to purchase or are curious, please go to the product page from the link below!
<<<Koropokkuru~Automatic Horizontal Lines~>>>

【Introduction to another product: ‘Koropokkuru~Triple Moving Averages~’】
The moving averages used in market analysis are displayed with the newly released indicator “Koropokkuru~Triple Moving Averages~”.
This indicator is aimed at those who are struggling with introducing or using moving averages.
Have you ever tried to analyze FX or stock prices or trade and considered introducing moving averages?
If so, you may have had concerns like the following.
・You introduced moving averages but can’t determine the best values for parameters, especially the ‘Period’.
・You introduced too many moving averages and lost track of what’s correct… you want to reset the over-usage!
・Different sites show different numbers of moving averages—one, five— which is right?
・You tried to tailor moving averages yourself but worry if it's correct.
This indicator solves all those concerns!
If you want to purchase or are curious, please go to the product page from the link below.
<<<Koropokkuru~Triple Moving Averages~>>>

I’m active on Twitter as well, so please follow me!

【Lastly】
Thank you for reading this blog until the end!
I hope it helps your asset management.