Indicator that displays Elliott Wave counts, target values, and Fibonacci retracements
Proposing a New Concept Indicator for Discretionary Traders Who Have Not Yet Seen Results
Even if you’ve taken a position…

That doesn’t mean you should study either…

Because you’re tired from work
you can’t continue
You don’t have time
you can’t learn
Up to now you’ve tried indicators…
but nothing seems to fit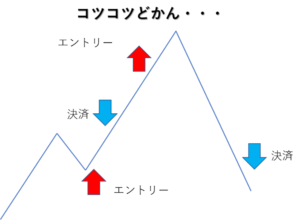
Ultimately, you want to trade with discretioninstead of a system

If you have these concerns
and aren’t achieving the results you want
The principle of market indicators
can meet your expectations.
Even beginners can, with this indicator, obtain technically correct exit scales
Ah, that moment when the “●●” you exited at suddenly extended this far…
Everyone has had such experience, right?
However, with a scale for exits backed by technical analysis,
those frustrating experiences will drastically decrease.
Also, with an indicator
you can acquire a consistent exit scaleand
the quality and efficiency of your validations improveand, as a result,
discretionary trading becomes easier to win..
So why?
Why are predictions using technical analysis consistently reproducible?
To put it bluntly, the answer is
Because technical analysis is
the statistics of behavior data driven by human instinct..
The exhilaration when you’ve made a lot of profit
the anxiety and fear as unrealized losses grow
the urge to lock in profits quickly
the rush to recover losses…
When people feel these emotions strongly,
instincts kick in and impulse-driven actions occur
and the probability becomes very high.
When a crush comes near during adolescence,
did you not act differently from usual?
You think you’re in control, but
you can’t help it.
That is
what we’ve collected as statistics on human instinct-driven action
Technical Analysis.
Even beginners can, with one click, know targets comparable to famous traders!
Here, what we mean by technical analysis is not
moving averages, RSI, MACD, or other technical indicators
but something broader.
Many people misunderstand this, but
technical analysis is only a small part
of technical analysis.
Technical analysis includes, besides indicators, support, resistance, trendlines, channels, chart patterns, Elliott wave, Fibonacci retracements, P&F charts, etc.
Among many technical analyses, if asked which could be a weapon for discretionary traders to win, I would answer without hesitation: Elliott Wave.
“Even if someone says Elliott Wave suddenly, I don’t understand.”
Among people here, some are hearing the term Elliott Wave for the first time, so here’s a quick explanation…

If you diagram the cycles of Elliott Waves, it looks like this.
<Image of Elliott Wave

If you understand Elliott Wave, you can foresee the market’s rhythm such as
“The rise seems to stop soon and a correction is likely.”
“The correction seems to stop around here.”
andyou’ll know the rhythm of price movements in advance.
Also, to some extent,you’ll have a gauge for how far price will move.
When I posted on a major forum,
using Elliott Wave theory to predict,
I repeatedly forecast price moves accurately during live trading.
The reason price moves predictably was
that I discovered the wave rhythm law of Elliott Waves by chance
and understood it well..
However, those posts are now deleted, so I’ll share reviews from people who know those times.
Source: FX site GoGoJyan kinchanbbh3’s newsletter/review excerpts
(Stock-Measure is not currently sold.)
Note: Contents reflect personal opinions only.


Purchase of the market principles indicator
But the key is
the Elliott Wave law discovered by chance,
how much of the price movement you can understand?
Right?
| Analysis of USD/KRW on February 18, 2020 (Tue) |
The scene in this video ↓
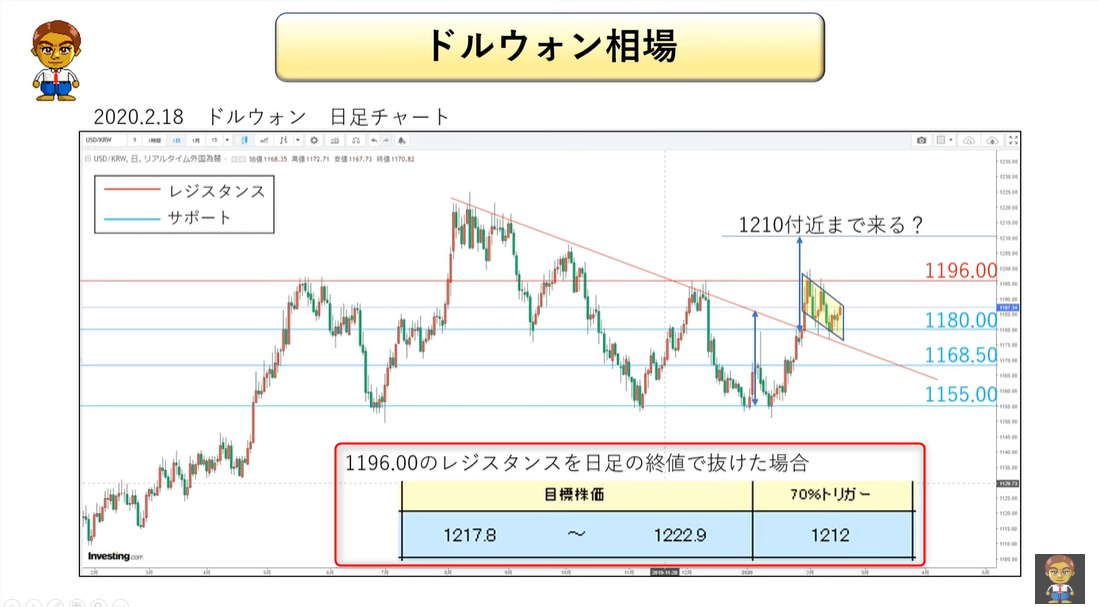
After reaching the target,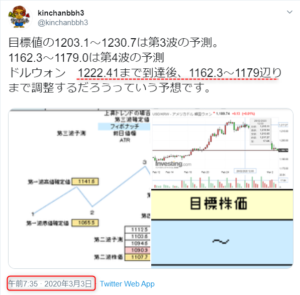
On Twitter, we specifically predict the points where a pullback will occur with concrete numbers
As a result…
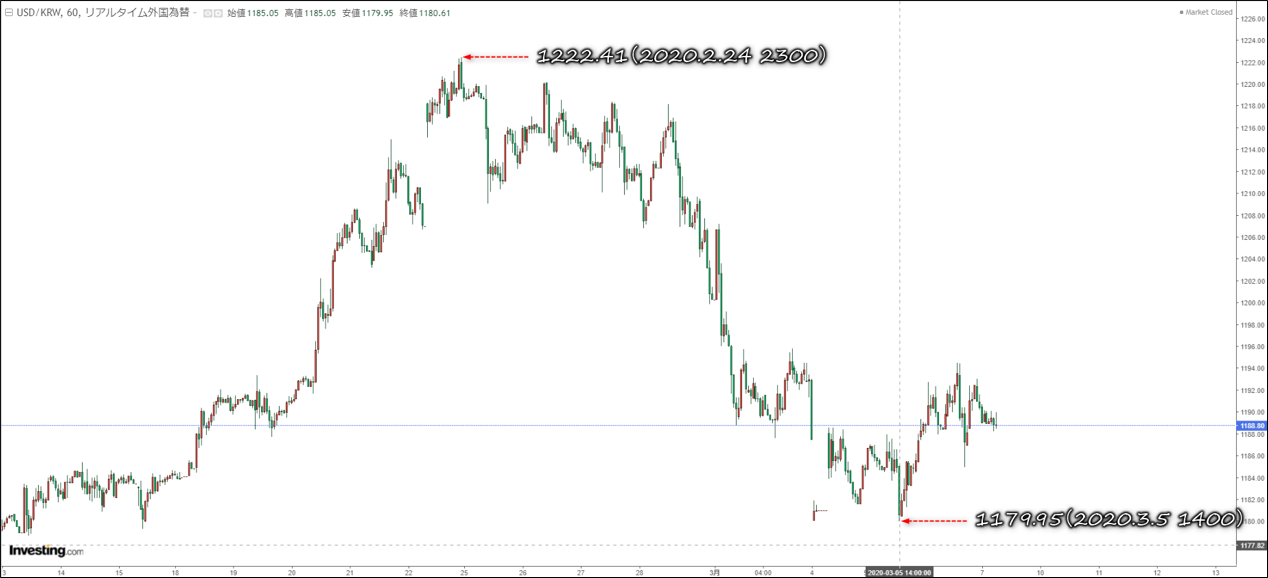
USD/KRW 1-hour chart after the video was posted
Also, an analysis one month later.
| Analysis of USD/KRW on March 13, 2020 (Fri) |
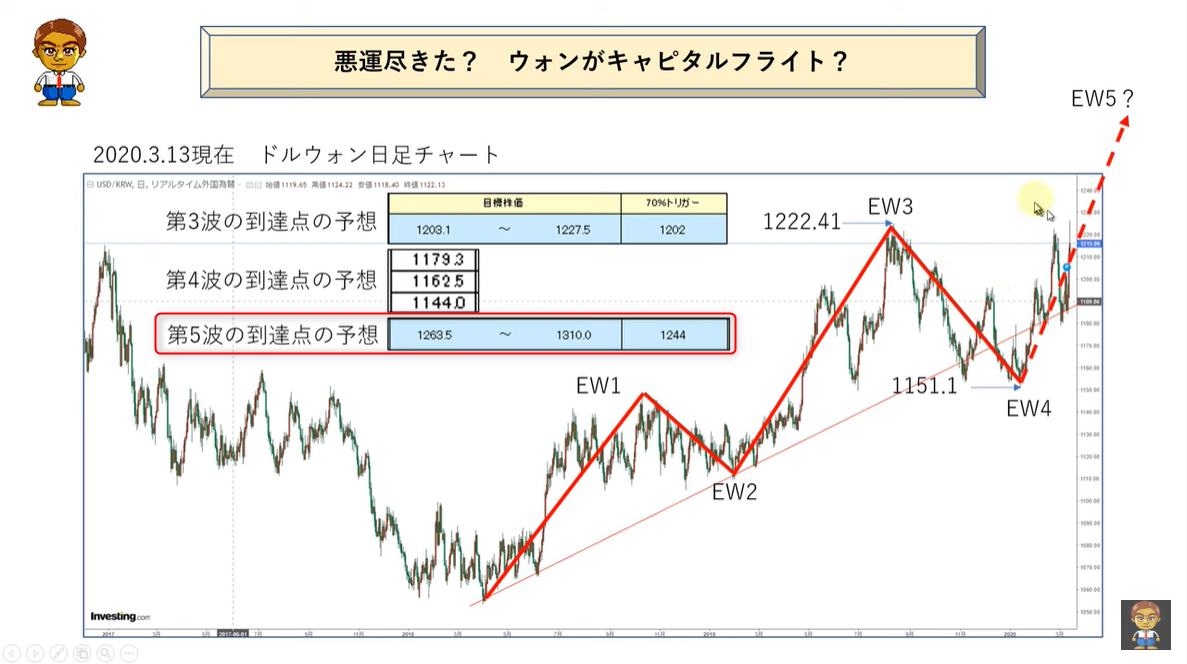
The result of this forecast…

Note: Contents reflect personal opinions only.
Since YouTube videos can’t be edited after upload, there’s no room for deception
.
Thisexits forecasting know-howisnot found anywhere on the internet
forbidden backstage techniques.
It is this high usability and reproducibilitythat makes my Elliott Wave theory know-how
able to output to a chart with one click
via a tool we developed.
and it can output not only Elliott Wave targets but also targets for chart patterns like flags and pennants and Fibonacci retracements.
Why I, a former Self-Defense Forces member, could achieve results with discretionary trading quickly
Discretionary trading cannot win
If you think that and are about to give up on winning,please read my experience.
For decades, from my teens to my forties,
I served in the Self-Defense Forces,
where harassment from supervisors worsened my depression,
and I abruptly retired from the military I had planned to serve until retirement.
I encountered a hostile supervisor via a transfer, and I unexpectedly left the force…
Even though government service had guaranteed stability until retirement,
the world is such that such things happen.
Ahead of you is a moment of darkness.
In such a situation where quitting would be understandable,
my wife supported me with a decision.
Not a tearjerker, but
if I don’t get motivated now, I’m not a man.
However, realistically I was a man in his forties with mental health concerns.
There are few companies willing to hire, and
I doubted whether I could adapt to an organization.
So I set my sights on day trading in stocks.
In fact, I’d been interested in stock investing since the military,
and my meticulous nature led me to study fundamentals intensely,
reading Zaї, Four-Season Reports, etc.,
and studying fundamental analysis rigorously.
Yet, even with good performing stocks,
the stock would drop due to “good news priced in,”
or rise despite “bad news priced in” due to issues in the earnings.
Every time analysts’ reports came out, it felt like they already knew the outcome in advance, leaving me puzzled about how they could be certain.
Being stubborn, I wanted to know why.
Thus, I learned that fundamental analysts prepare two reports in advance: one when earnings are good (to explain why stock rose), and one when earnings are good but the stock fell due to expectations, to explain why it dropped.
Even professionals who manage fundamentals sometimes don’t know whether prices will rise or fall
I shifted my focus to technical analysis for trading.
Trading became my vocation.
The market, if you do something reckless, will punish you with losses; if you work hard, it will reward you.
There’s no harassing boss, no complaining subordinates.
With family finances on the line, I studied for eight months and finally debuted as a discretionary trader.
Daily profits of 20,000 yen to 30,000 yen, sometimes equal to a month’s salary from my days as a sergeant.
But not everything went smoothly.
There was a time I got carried away.
I made about 20,000 yen in profit, finished a trade, and had spare time.
“If I make another 10,000, I’ll stop.”
I entered a stock that was a typical pump-and-dump, and I overtraded beyond the proper risk,
and I lost 1,000,000 yen in an instant,
and the profits I had built up disappeared in 10 minutes.
Inside me arose the thought,
“I want to bet big and quickly recover the losses.”
I realized this would become mere gambling, so I stepped back from the market and took a break, following the guidance of those who went before me.
I still wanted to trade, but
I accidentally discovered a certain regularity, and
I found the thrill of validating it every time,so I kept my distance from the market.
On a large forum, when I tried predicting price movements and posting, results were strikingly accurate..
● I had been keeping detailed trading logs and understood my own trading expectationsto be true.
● I took breaks during unfavorable periods and verified reproducible phenomenawith high repeatability
● I acquired, even if by chance, a highly reproducible skill.
My rapid success as a day trader, despite being a beginner, came from eight months of thoroughly absorbing the basics of technical analysis,
repeated validation to internalize it,
and the lucky discovery of a principle,
which was the result of those efforts.
In other words, by raising overall capability, you can win in the market.
A culmination of extraordinary effort and accidental encounters—this is the essence of the market principles indicator.
It isthe Market Principles Indicator.
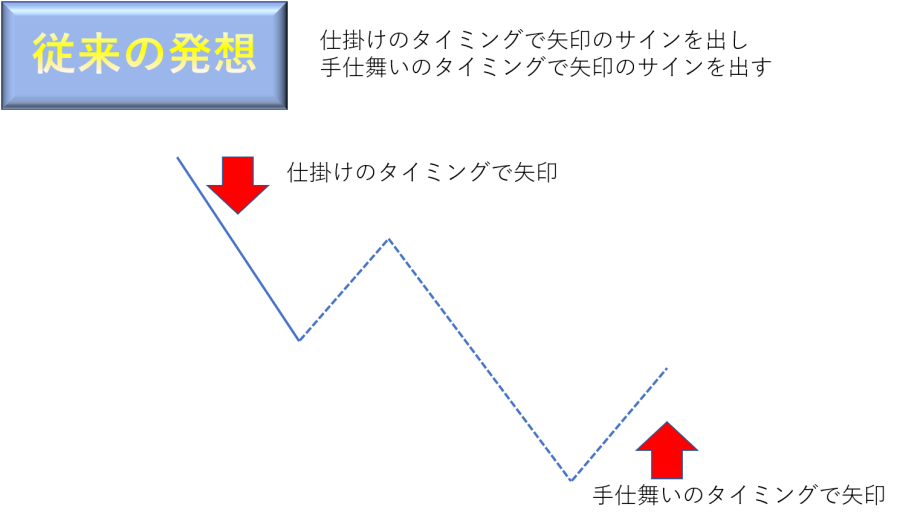
Why this indicator overturns the conventional FX indicators! That is why it works! A new idea for indicators
Until now, indicators in the FX industry were focused on timing entries with arrows and exits with arrows—more precisely, indicator-focused on entries.Traditional indicator methodshad the advantage of being easy to understand, but
|
and as a result, if the indicator stopped working, you couldn’t win anymore.
Therefore, no matter how much you log your trading diary,you can’t know the expected value, and it’s hard for discretionary traders to sustain consistent wins.
NowIs automated trading—EAa solution? So, let’s consider an EA with a 99% win rate and a profit factor of 2.0..
Profit factor is a standard that measures total profits divided by total losses,and a value above 1.0 is a positive expectation, below 1.0 is negative.
out of 100 trades, 99 wins and 1 loss, with a profit of 20,000 yen and a loss of 10,000 yen This implies
a profit of 20,000 yen divided by 99 is about 202 yen per trade a loss of 10,000 yen divided by 1 is 10,000 yen per loss.
risk-reward is 1:0.0202.
This means you repeatedly take a risk of 10,000 yen to gain only about 202 yen.
Furthermore, in this kind of risk-reward trade,you need win rate above 99% to win.
95% win rate means 1 loss every 20 trades, so outcomes would be 19 wins and 1 loss. Then,total profit would be 202×19=3,838 yen, total loss 10,000×1=10,000 yen Thus,a useless EA that largely reduces capital.
|
|
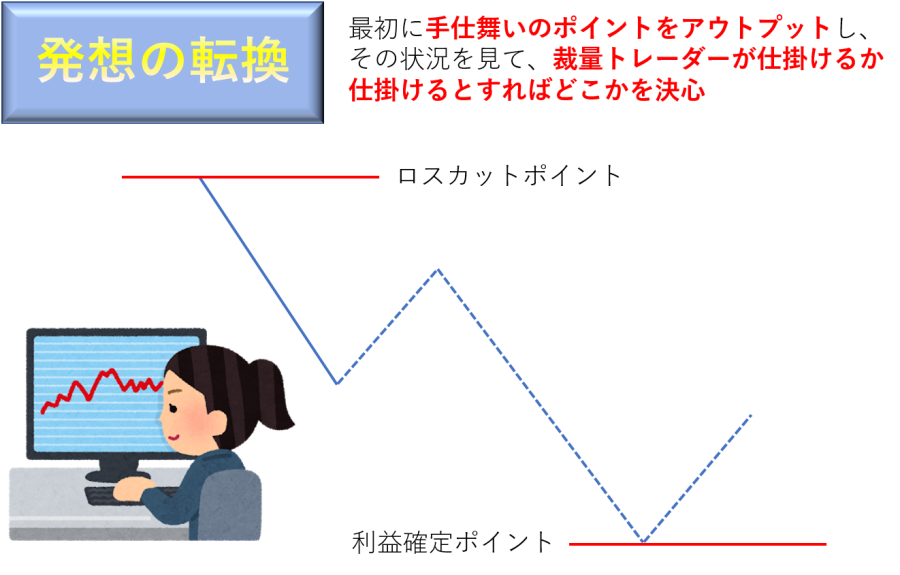
In the new concept Market Principles Indicator,the first thing output is the exit point on the MT4 chart.
Moreover,and.
Professional traders prioritize risk control over win rate.
Becausethat increases the probability of profits remaining.
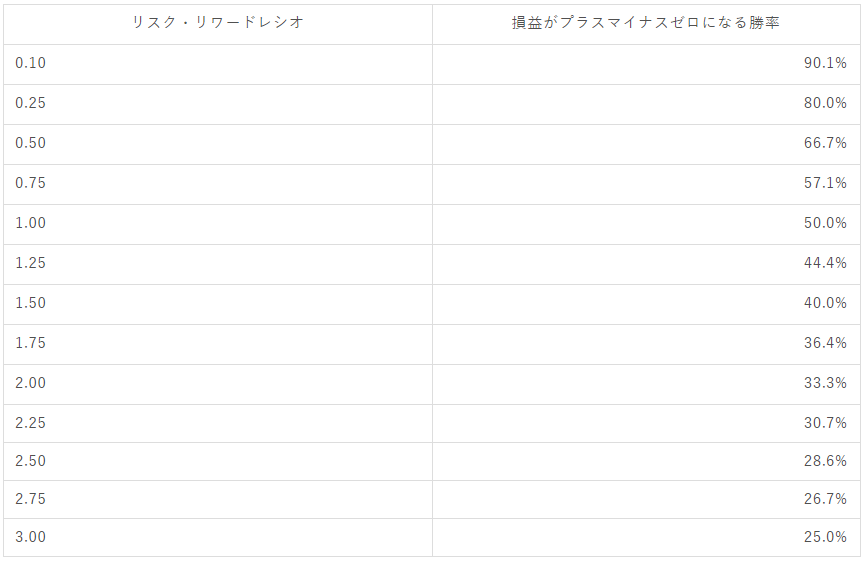
The table above shows win rates needed for a risk-reward ratio to be positive and negative.Risk-reward ratio is calculated as expected reward per winning trade divided by expected loss per losing trade,and values above 1.0 indicate rewards exceed risk.
If you control risk downward and increase reward,
you can achieve a win with a risk-reward ratio of 1.5 or higher, and a win rate of 40% or more can still yield a profit.
Additionally, the Market Principles Indicator will include a real-time display of risk-reward ratio as a bonusfor free.
|
When the target value is known, you know the risk-reward; when you know the risk-reward, you don’t get misled by the victory-talk
Do not be swept away by the word “win rate.”
As explained above,
you can win by taking a massive risk and receiving minuscule rewards, and anyone can do it.
That trade has almost no edge.
If your trading becomes sloppy and risk rises, the chance of winning decreases.
Therefore,recognize risk-reward clearly, improve trade quality,and
select high-expected-trade opportunities and adopt a 50-50 mindset as a shift in thinking.

The right image shows the performance I achieved on Twitter over a period of about 10 months, pre-announcing stock setups and exits before executing trades.
It was 227 trading days with 610 trades, which isn’t a huge number.
Win rate was 335-275, a win rate of 54.9%
Profit factor was 1.58.
However, with this relatively small number of trades and modest win rate, compounding would yield more than 10x in less than a year.
June 3, 2019: “Financial Commission Market Working Group Report, ‘Asset Formation and Management in an Aging Society’”states thatpension benefits leave a shortfall of about 50,000 yen per monthin retirement funds.
This implies that, if retirement lasts 20–30 years, you’d be short by1,300–2,000万円 in financial assets
.

Indeed, Japanese people must seriously consider asset formation, as longevity could become a risk.
Whether you want to work into your 70s, 80s, or 90s or live in comfort depends on building sufficient financial assets.
At minimum, you could not reach this level for the price of this indicator.
A New Type of Indicator with Potential Synergy with Quality Information Products
Market Principles Indicator does not, like many predecessors, focus on entry arrows and exit arrows in a time-series sequence.
Instead, it outputs exit points first, and then informs the entry decisions, a fundamentally opposite approach to traditional thinking that supports discretionary traders.
New Indicator
Why I Released the Market Principles Indicator
In the military, I studied tactics at the Officer Candidate School, but the entry point that was drilled into me was the principles of combat.
And similarly, the market also has principles.Whether in stock, FX, commodities, futures, or crypto, the principles hold.
Until recently I was a civil servant, virtually unknown in the trading world.
I bet on reproducibility of logic alone, and

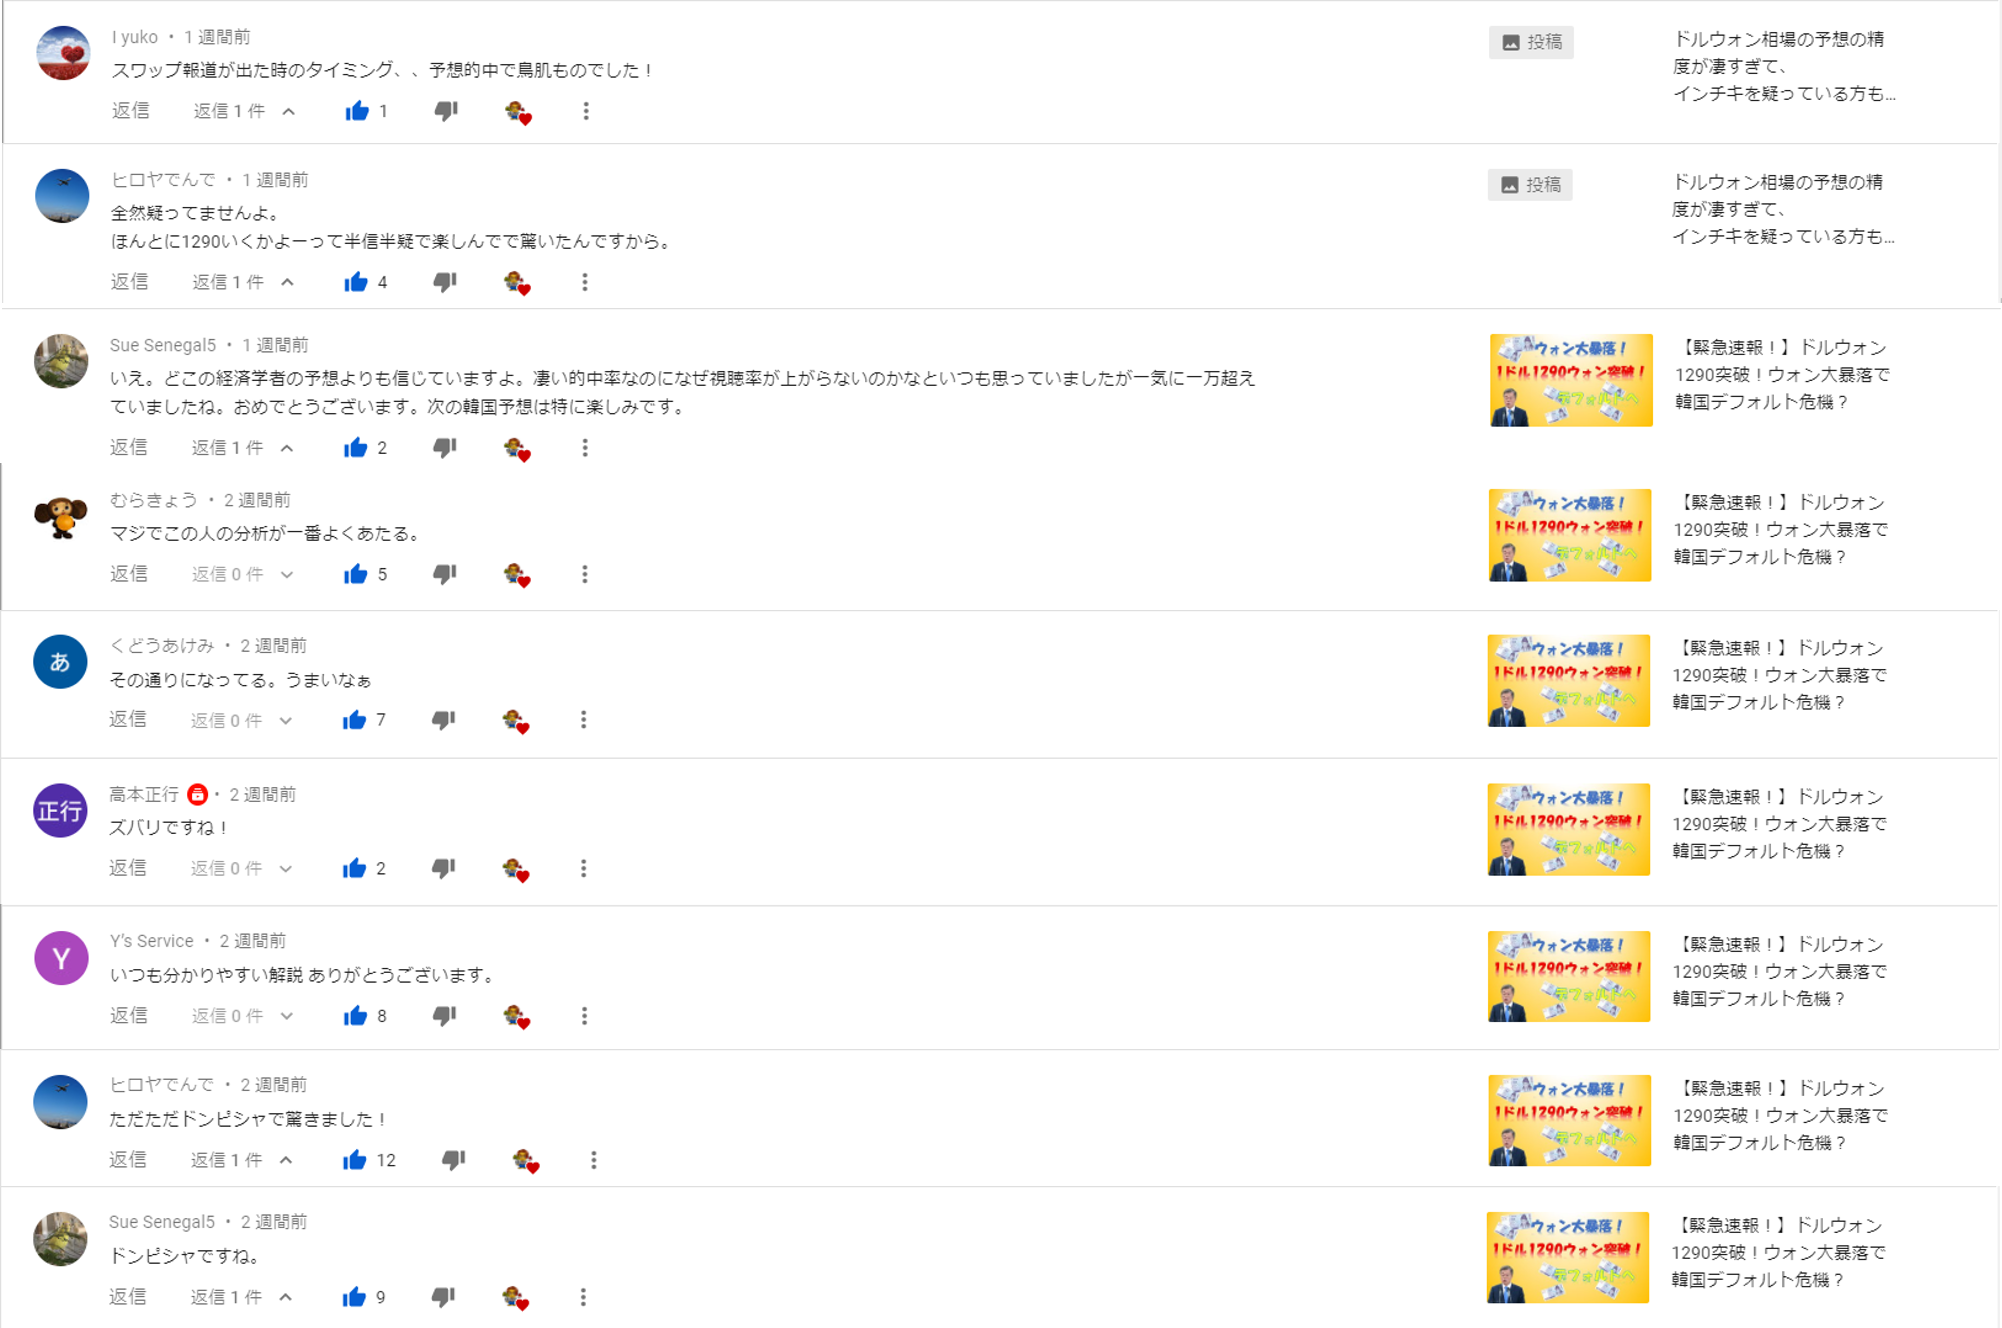
Comments on YouTube, which have higher credibility than product reviews, show the value of the logic.
Note: Contents reflect personal opinions only.
Buttechnical analysis has gained citizen’s rights and spread worldwide over many years, and its reproducibility has not decreased.
With billions trading technically,the same logic remains.
Here, even hundreds, thousands, or tens of thousands using this logic will not change anything.
| In our newsletter used by many, high accuracy every issue |
◆ USD/JPY 4-hour pre-output target
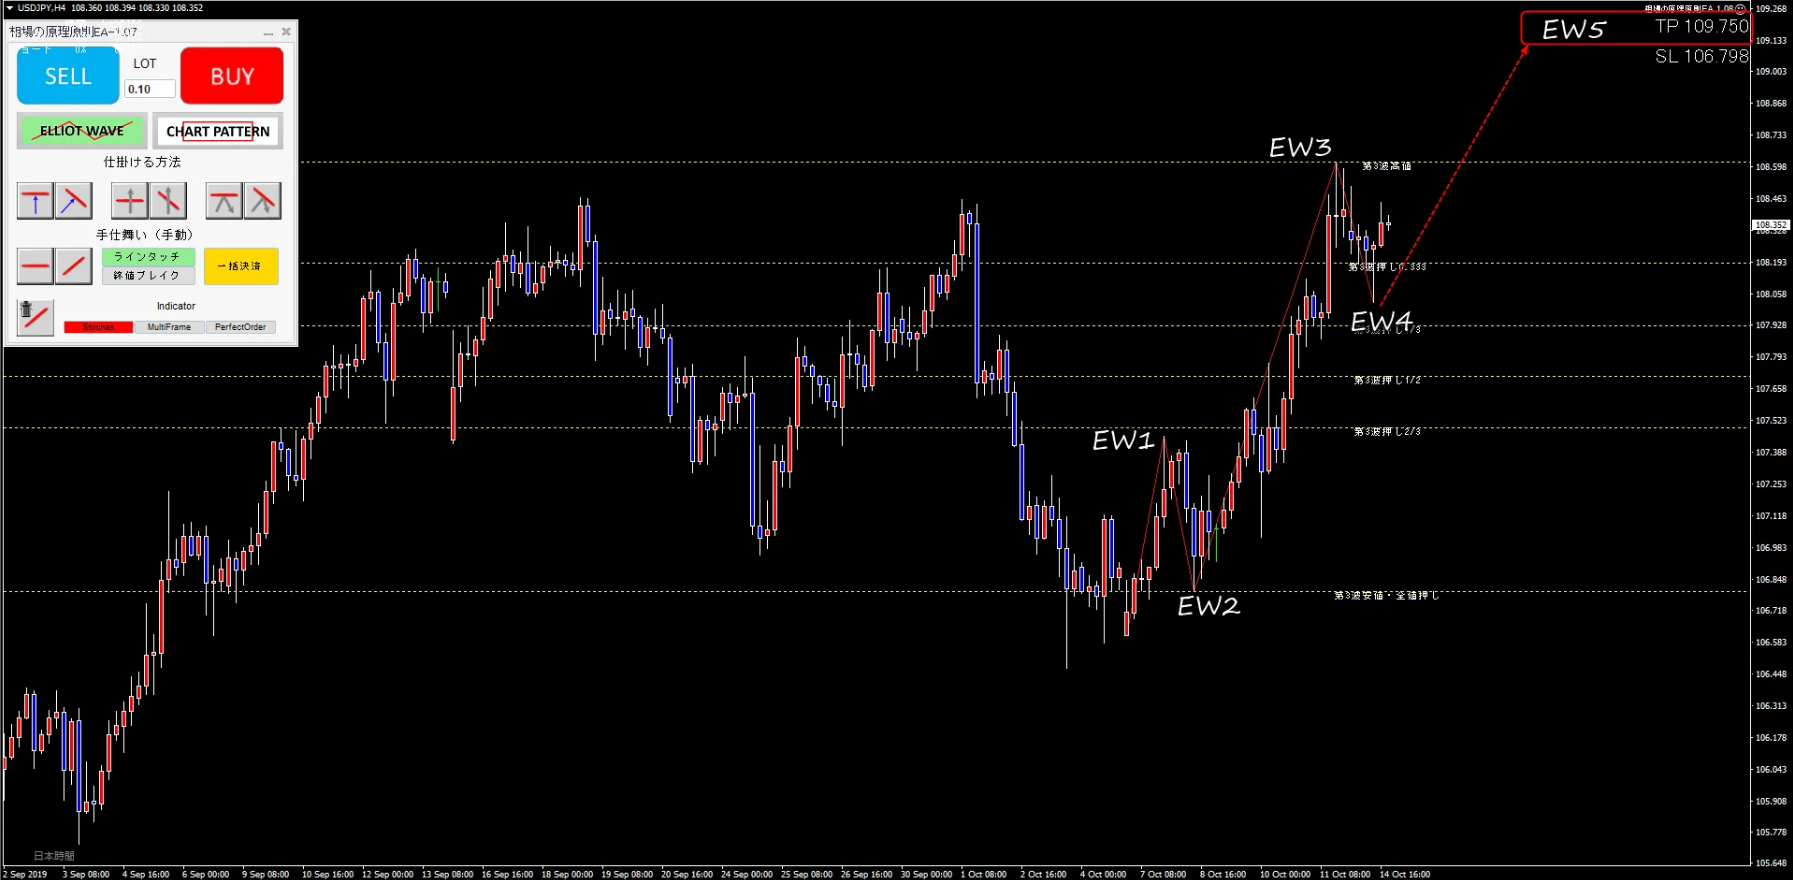

◆ USD/JPY 4-hour result: 108.352→109.720
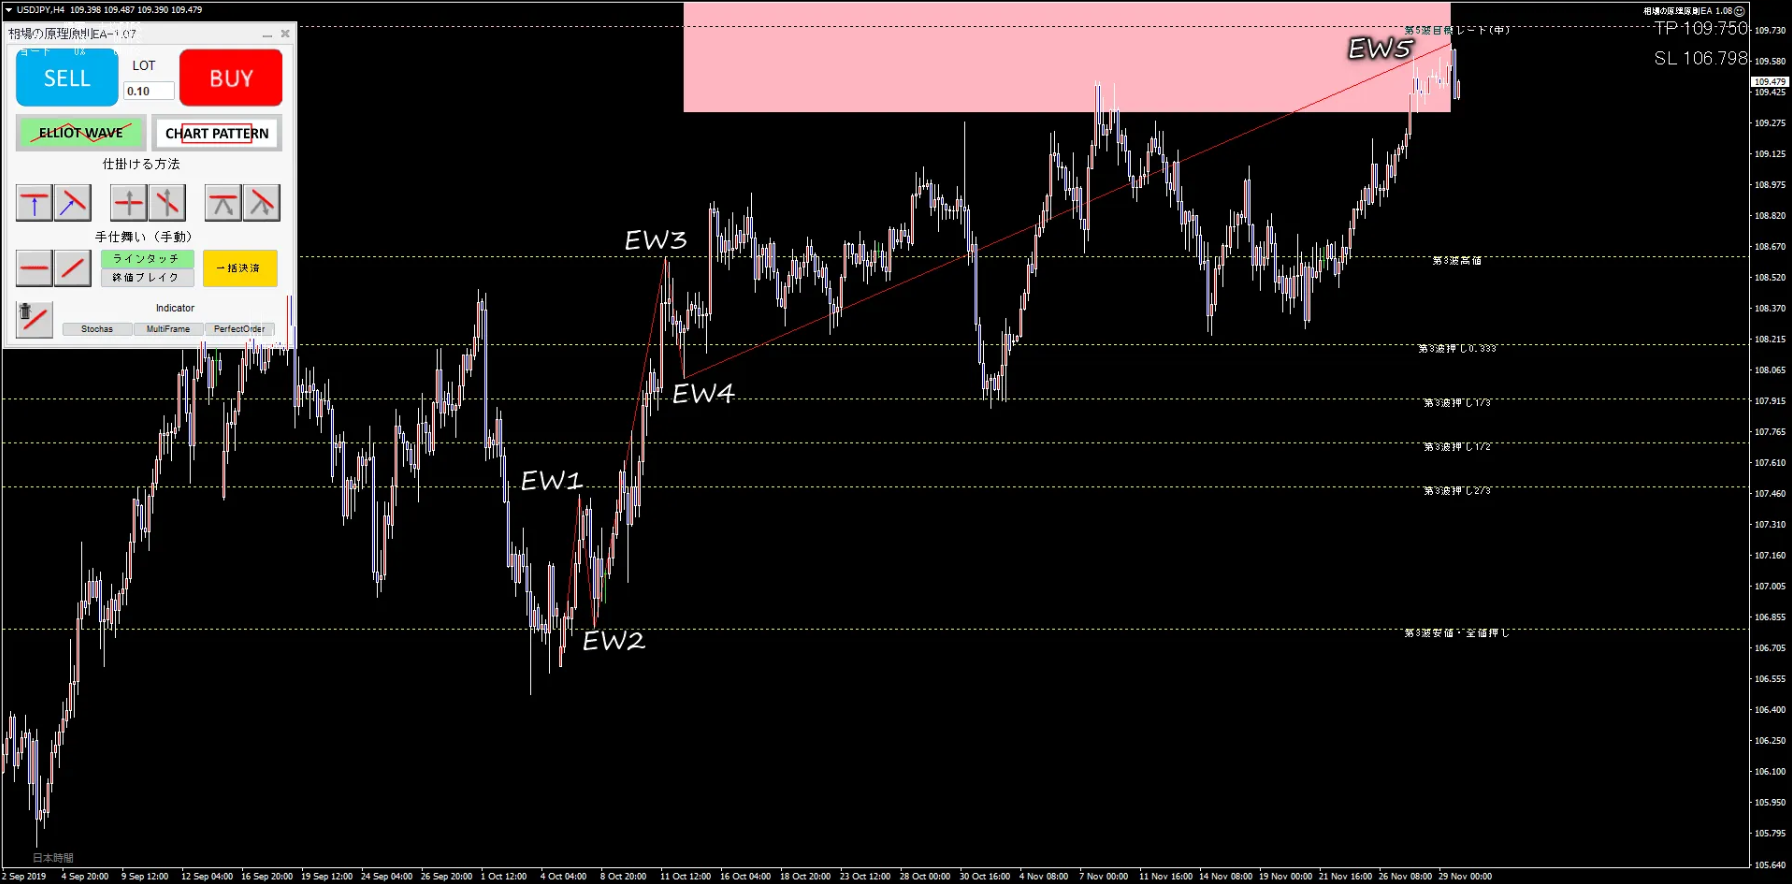
Note: Tools shown in images are EA using the same calculation logic, not the Market Principles Indicator.
| Pound-Yen moved significantly with Brexijud |
◆ GBP/JPY 15-minute pre-output target
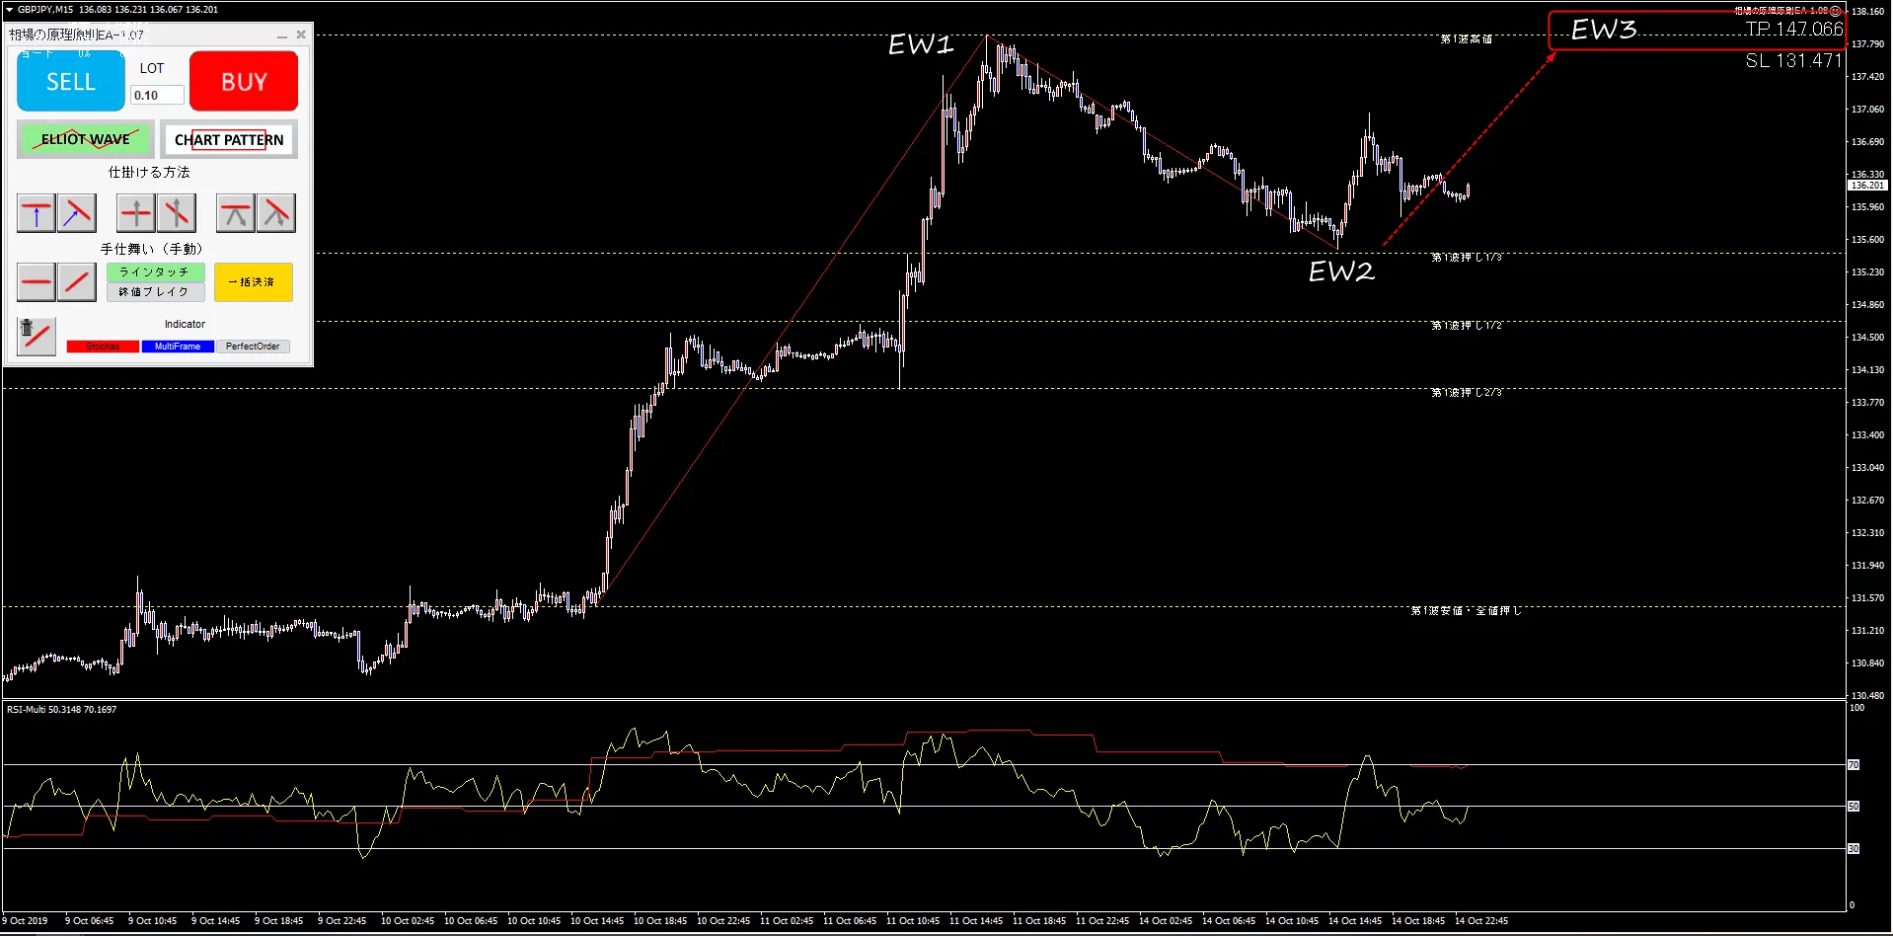
◆ GBP/JPY 15-minute result: 136.200→147.945
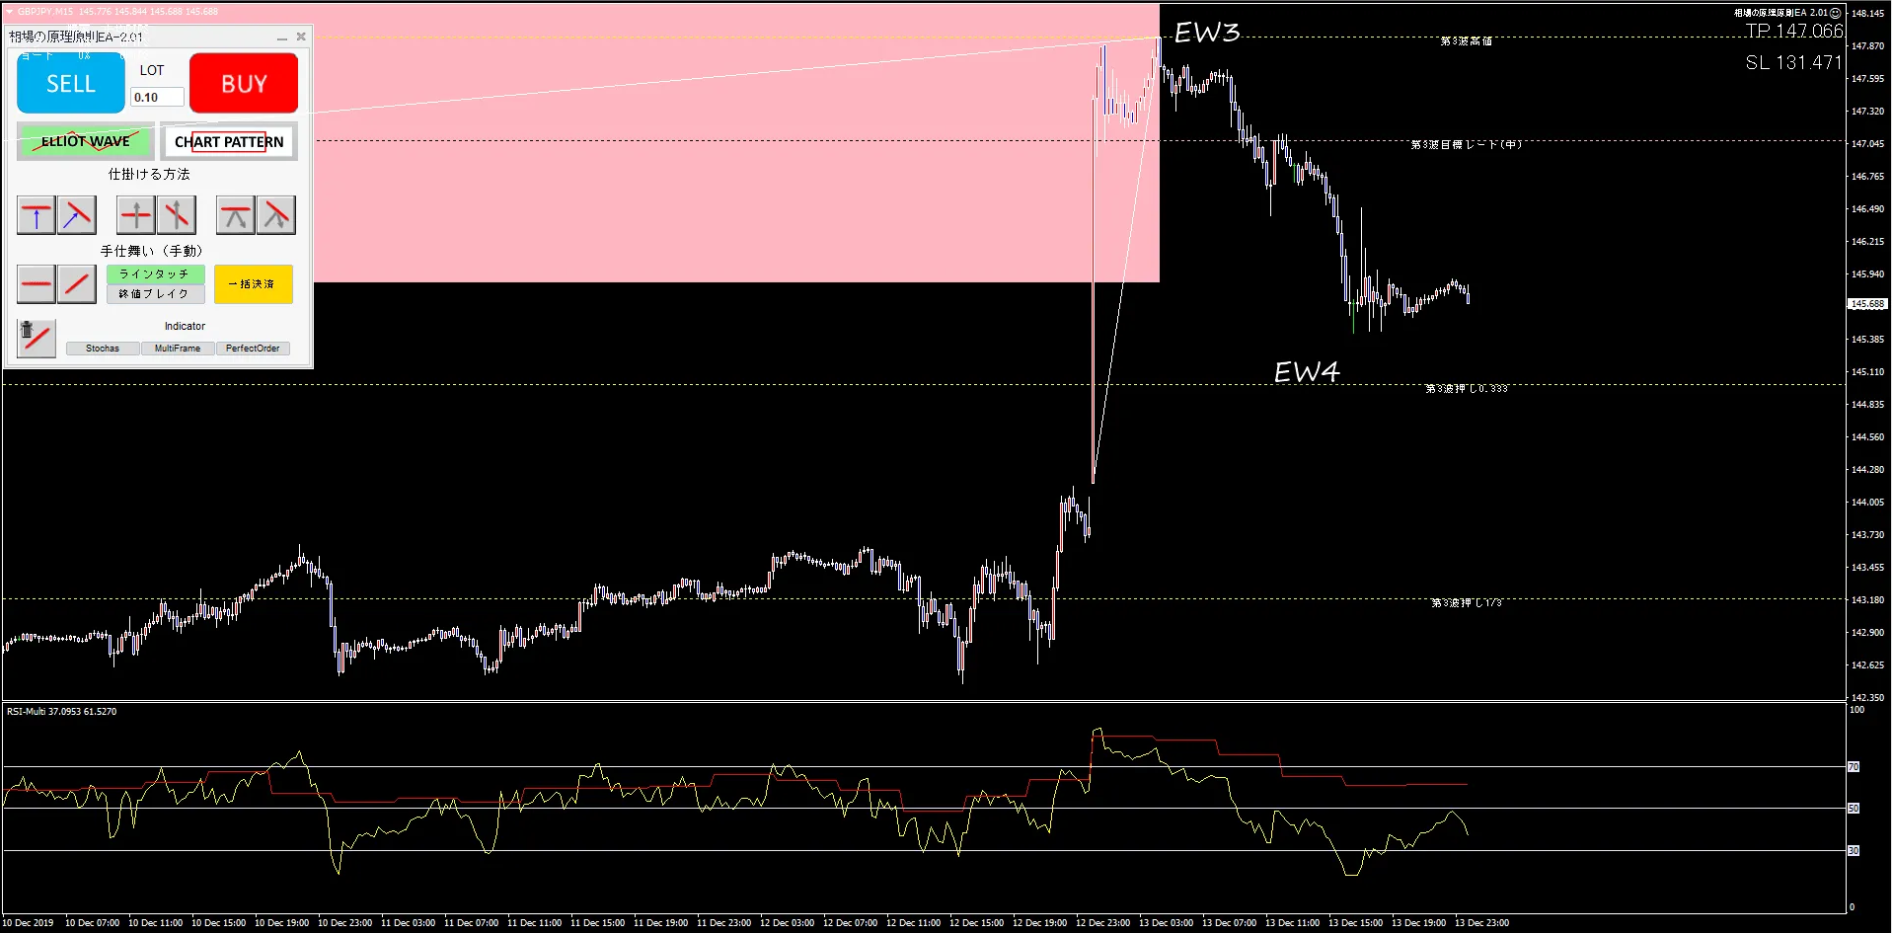
Note: Tools shown in images are EA using the same calculation logic, not the Market Principles Indicator.

Regarding newsletter reviews, many parts use Market Principles Indicator for price movement forecasts.


| Trading example using Elliott Wave third-wave targets |

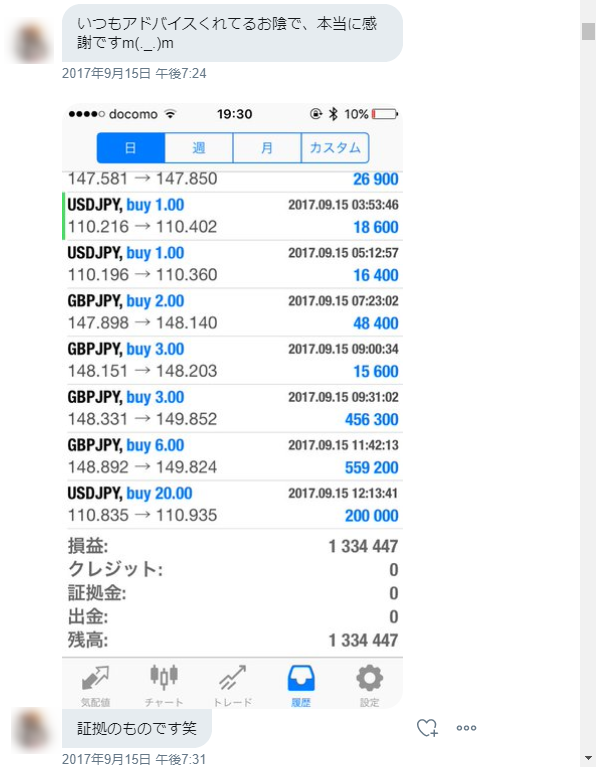
(Stock-Measure is a prior generation of Market Principles Indicator; LINE message from a Stock-Measure user.)
Discretionary Trader Support Features No.1
|
◆ Output Elliott Wave targets with one click! Just click the starting candle of the Elliott Wave, and instantly output Waves 1–5, and draw the zone where Waves 3 and 5 are expected to reach on the chart. Provides stable and consistent exit, risk-reward, and expectancy scales for discretionary trading. |
Discretionary Trader Support Feature No.2
|
◆ Display Elliott Wave Fibonacci retracements on the chart Instantly show Fibonacci retracements based on the amplitude of Elliott Waves 1 and 3, helping discretionary traders intuitively recognize pullback levels and entry timing. |
Discretionary Trader Support Feature No.3
|
◆ Recognize flags, pennants, and small consolidations to output targets instantly When discretionary traders recognize flags, pennants, or small consolidations and perform a simple set of tasks, the tool draws exit targets for the bullish break and bearish break on the chart. |
Discretionary Trader Support Feature No.4
|
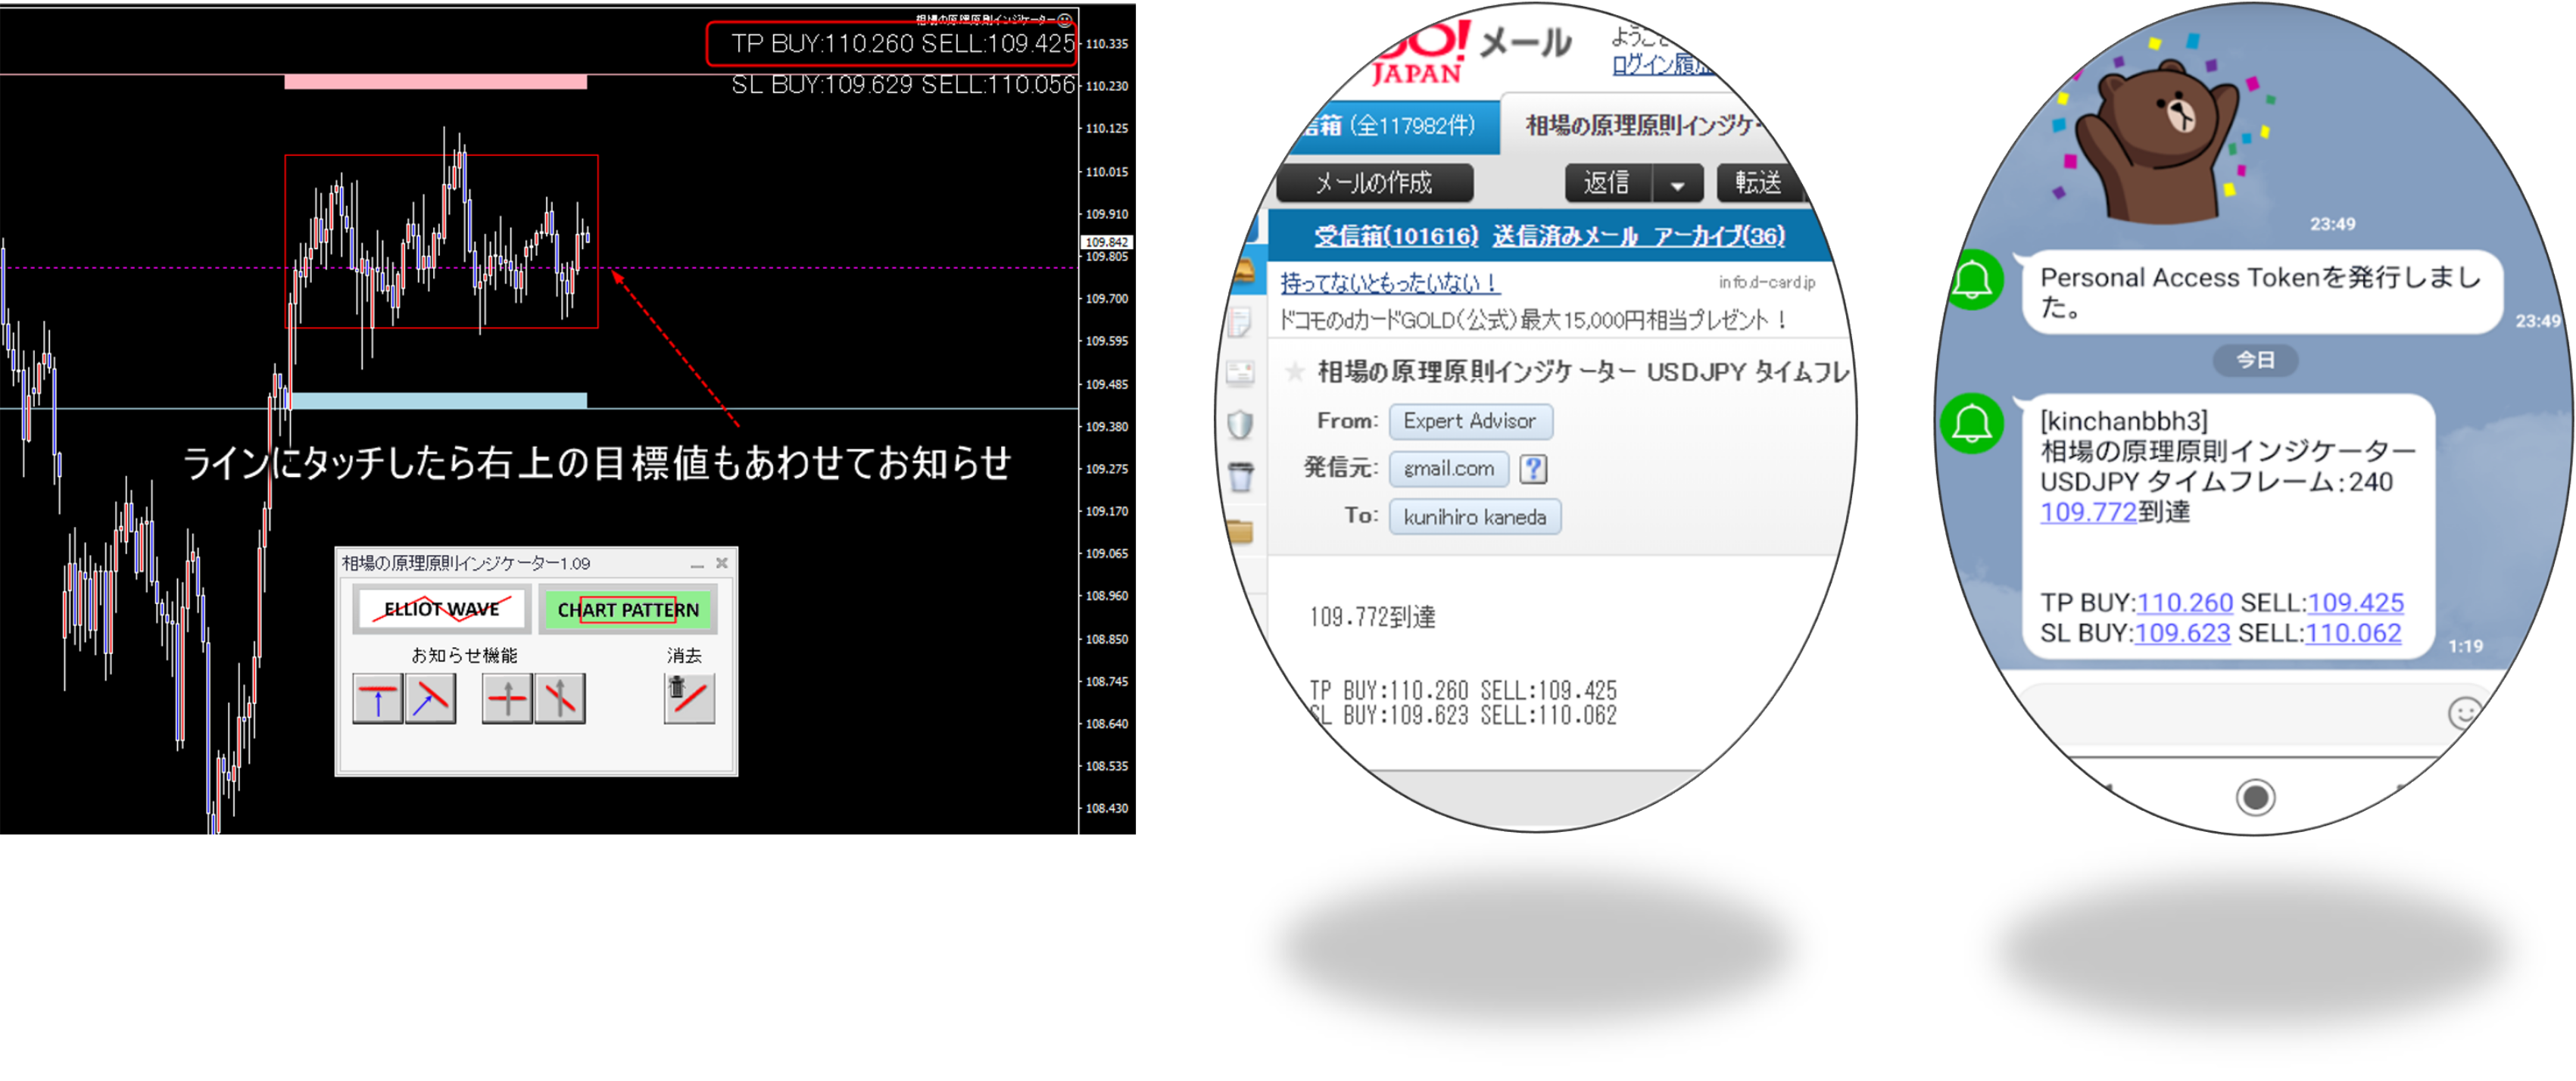
◆ Notify via LINE or email when the trader’s triggers are reached If you set up triggers such as break of a trendline or horizontal line, the indicator monitors and notifies you by LINE or email when conditions are met. Also, if you output Elliott Wave or chart pattern targets, TP and SL values are also delivered via text, so you can execute detailed strategies remotely without staying glued to the chart. Note: TP/SL values are recommended; there is no settlement function in this tool. |
Discretionary Trader Support Feature No.5
|
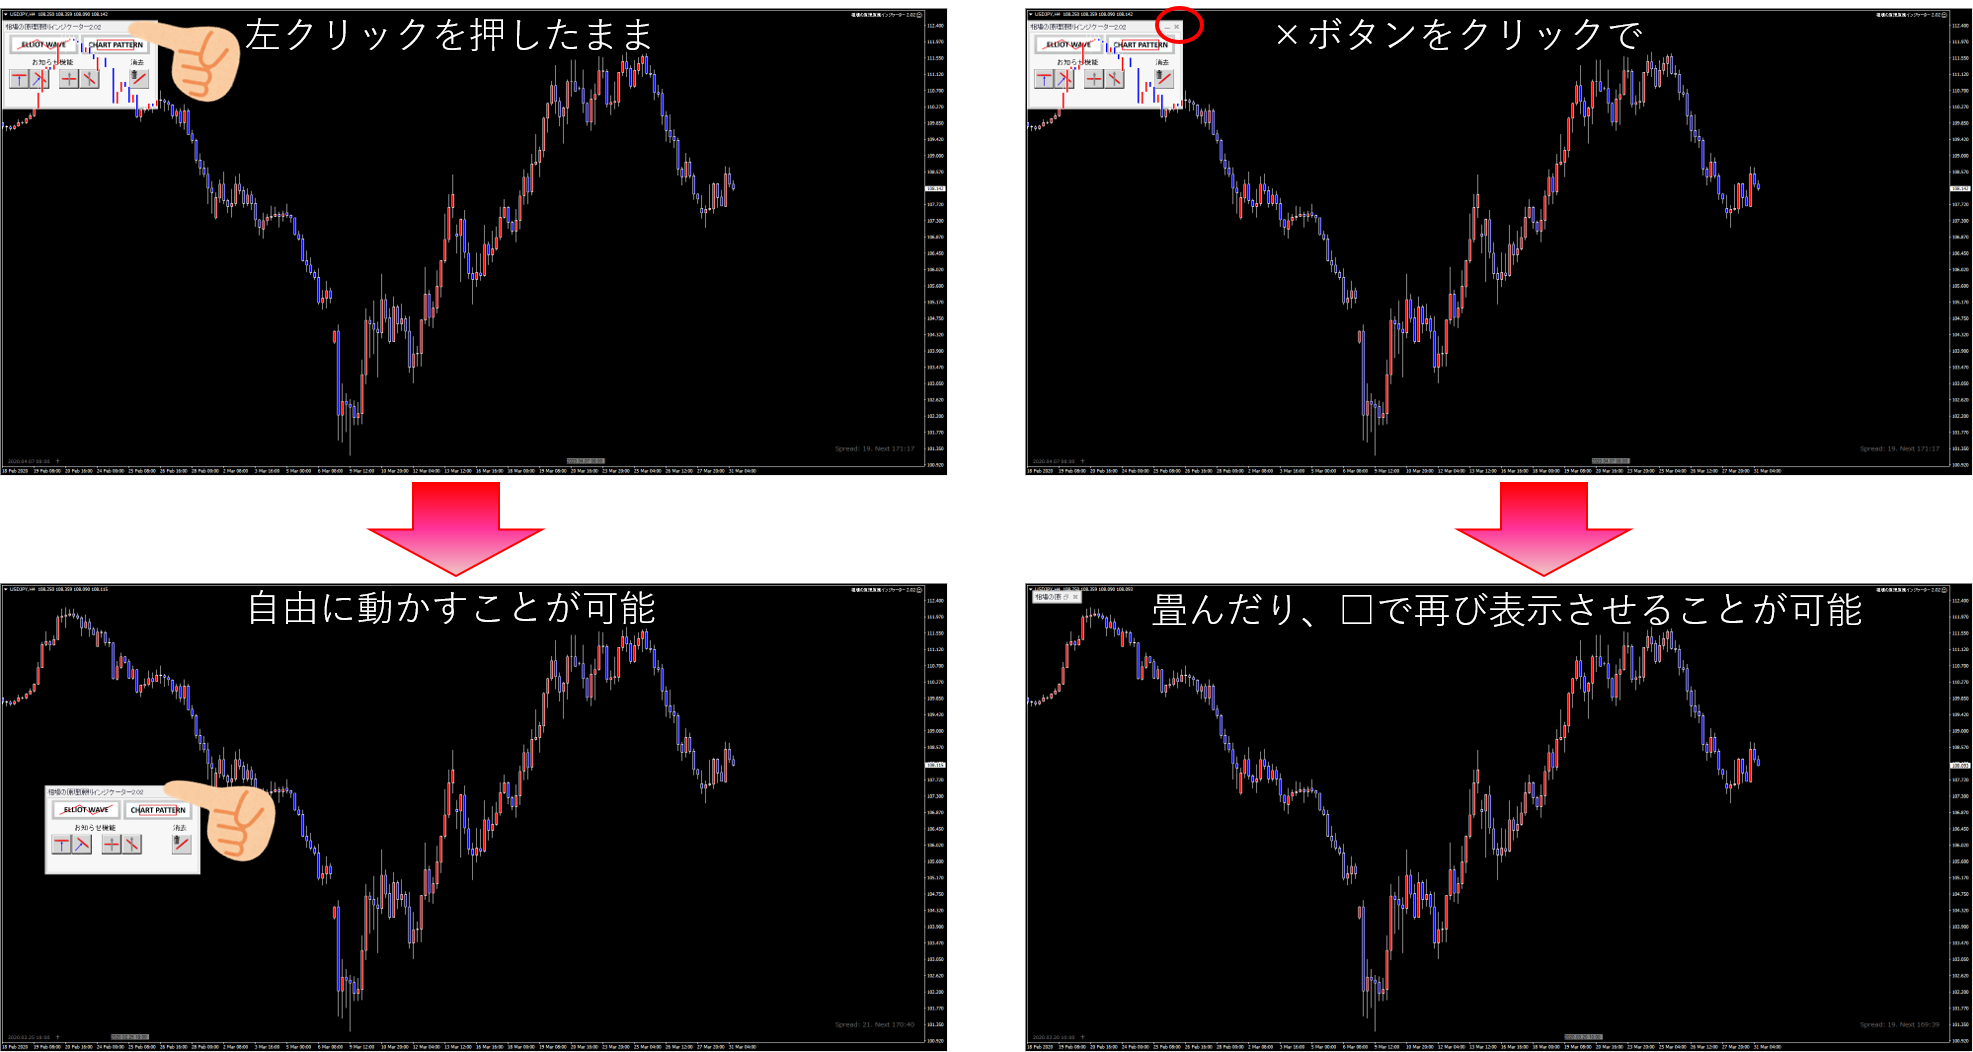
● Design prioritizes usability; non-intrusive chart analysis Some indicators or EAs have fixed positions or require changing settings, making them hard to use. This indicator focuses on usability and can move or collapse without obstructing chart analysis, for a comfortable workflow. |
Discretionary Trader Support Feature No.6

|
◆ Markets-agnostic: All-in-one FX, CFDs, and Bitcoin Market Principles Indicator can be used across markets, so you won’t miss chances and can trade in charts where you’re strongest, improving trading quality and win rate. |
Value of the High-Performance, Knowledge-Pilled Market Principles Indicator
To reach Market Principles Indicator, I endured a tremendous amount of trial and error.
Initially, I attempted to automate Elliott Wave detection to enable automated trading.
However, since I had never used automated trading EA or indicators, even drafting a specification was challenging.
I rarely use technical indicators in trading, so telling a programmer where Elliott Wave starts was extremely difficult.
Ultimately, detecting the starting point of Elliott Wave could not be completed, but to hire excellent programmers, development costs grew.
Previously, Stock-Measure, like Market Principles Indicator, released a course that outputs Elliott Waves, but back then I largely built it in Excel with some outsourcing, keeping development costs around 100,000 yen.
Even with such tools, pricing it at 50,000 yen and demonstrating reproducibility on a popular forum brought high praise.
Based on Stock-Measure’s success, I priced this at 50,000 yen, but
①
② 90-day unlimited email supportIf you have questions about Elliott Wave starting points, chart pattern outputs, MT4 setup, etc., you will receive unlimited, thorough email support (also via Twitter DM).
③ Dedicated site with generous support
This PDF can be downloaded for free on the dedicated site (worth about 10,000 yen).
⑤ Risk-reward display indicatorThis shows the risk/reward ratio for discretionary trading in real time in Japanese yen, along with estimated losses and gains, and outputs the maximum allowable lot size per trade to assist money management rules.
An indicator that provides essential information for discretionary traders free of charge.
|
Delivery of the product After payment, download the product within 14 days from your Infotop My Page. The guide PDF allows you to log in to the dedicated site described in the PDF to enter your Infotop order ID and the account number you will use, then download after submitting. Web verification is performed within 24 hours. |
|
Investment risks and fees |
|
System requirements CPU 3.0 GHz or faster / Memory 8 GB or more / Internet connection wired (wireless also supported) |
|
Among the crowdto become buried in the massesor to break through the choice is now. |
There are two types of traders who win in trading.
Genius or average person
these are the two kinds.
Geniuses win by intuition, sense, and the inherent courage to trade.
Such people probably wouldn’t come here.
Average people, being average, tend to copy everyone else.
However, there is a way for average people to win.
That is to understand ordinary people’s actions,
anticipate those actions, and devise a strategy in advance.
The Market Principles Indicator is a tool to predict ordinary people’s actions.
Right now, you have found one path for average people to win in the market.
Whether you continue trading along the current trajectory or take a little courage to act here may be your turning point.
If you choose to invest time, effort, and money on your own, and study, and continue as before paying tuition and practicing, you can buy time and effort for your future improvement in trading.
Purchase Market Principles Indicator
Note: After purchase, you will need to submit your account number.
※ text above this line is public to everyone
If you delete these notes, everything becomes public to everyone, so please be careful.
※ the portion below this line is for purchasers only
(For purchasers, please modify this section accordingly)