【Dollar/Yen / Euro/Dollar / Pound/Yen】Market analysis for Friday, April 10, 2020
【Dollar/Yen, Euro/Dollar, Pound/Yen】 Market Analysis for Friday, April 10, 2020
Good morning, everyone! This is Yururi mo Yururi.
Thank you very much for visiting this blog.
I have updated the blog on the market analysis forFriday, April 10, 2020.
Three currency pairs: Dollar/Yen, Euro/Dollar, Pound/Yen are discussed.Please take a look.
Be sure to check it out!
<<【Dollar/Yen, Euro/Yen, Pound/Yen】 Market Analysis for Friday, April 10, 2020>>

We have started selling the new indicator “Koropokkuru - Angle is King Series -”
An indicator that emphasizes the angle of MACD and OsMA and displays signals.
Stable version for reliability, and an “Early Detection” version for early insight are available.
Please take a look!
<<【All 4 Types Best Set】 Koropokkuru - Angle is King Series >>
☆ Currently on sale at a special price for a limited time and quantity ☆
Backtesting results of the indicators are now公開されています。

We have公開ed for other currency pairs and timeframes, so please refer to them for参考.
<<Koropokkuru - Angle is King Series - Standard and Early Version Results>>
This week's market analysis is also on the blog. If you haven't read it yet, please take a look.
<<【Dollar/Yen, Euro/Dollar, Pound/Yen】 Market Analysis for April 6–10, 2020>>
【Backtest of Koropokkuru Series Indicators】
This is a video of backtesting the indicators for last week (March 23–27, 2020).
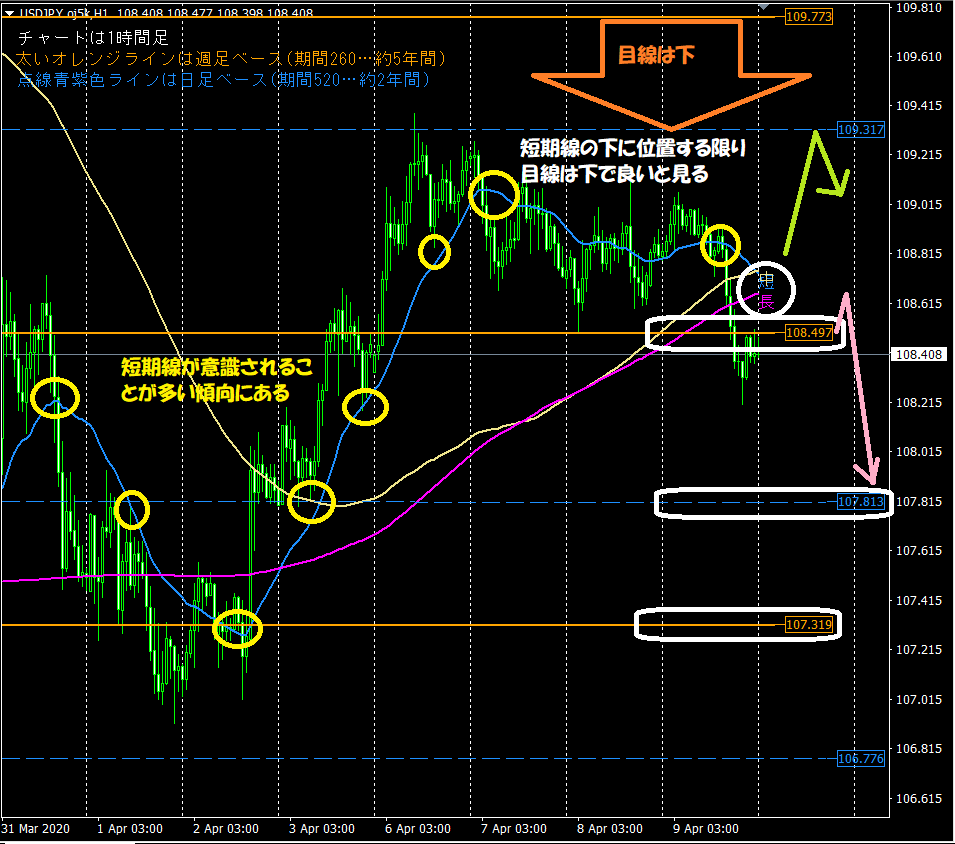
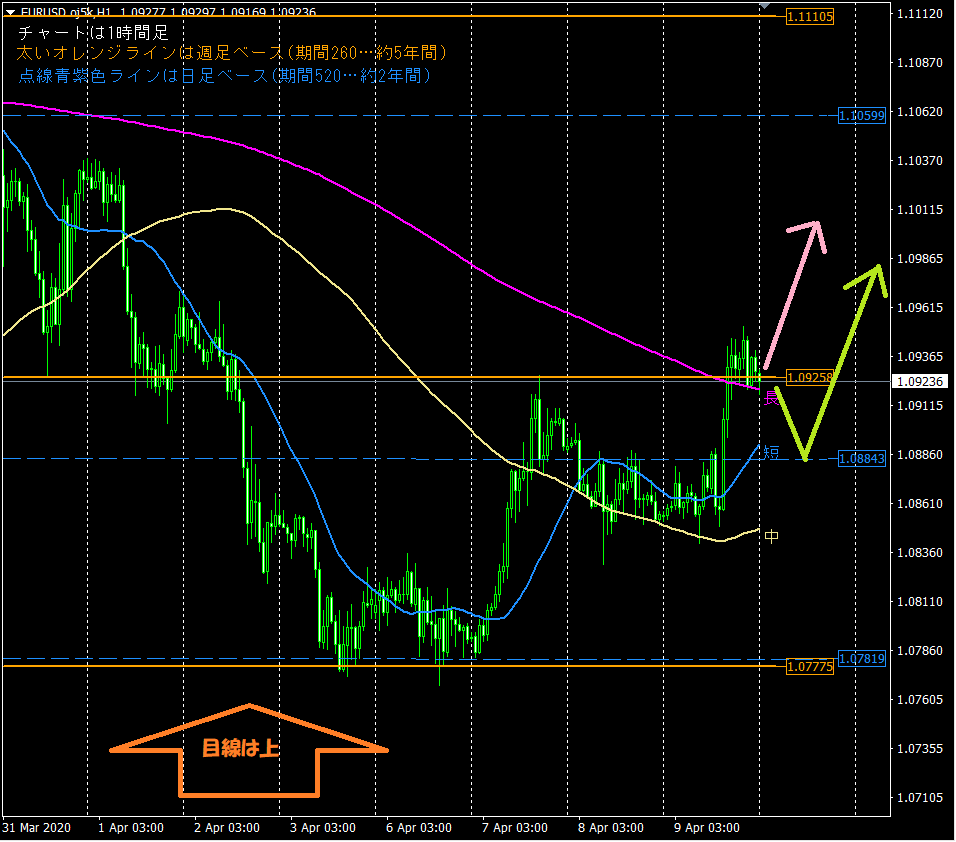
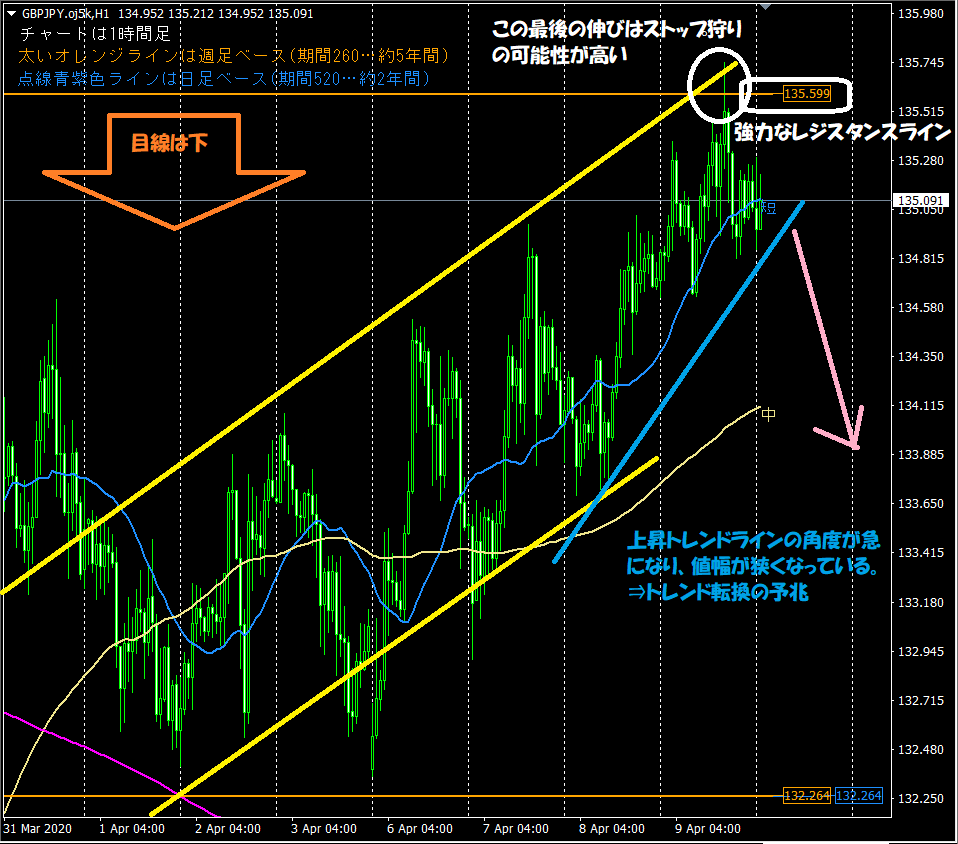
This is the hourly chart used in the blog's daily chart analysis. Key points to note are two things:1. The horizontal lines automatically displayed by the indicator function as support/resistance
⇒ Thick orange line (weekly basis period 260… 5 years), purple dashed line (daily basis period 520… 2 years)
2. Moving averages optimized for the 1-hour chart are often respected
⇒ Especially short-term line (period 24… 1 day) and long-term line (period 480… 1 month)
【Introduction of products for sale: 'Koropokkuru - Automatic Horizontal Line Display'】
The indicators used for market analysis are designed to automatically display horizontal lines to reduce trading burden. and were created with that goal in mind.
It analyzes the highest and lowest prices within a specified period by price tier and automatically displays up to three optimal horizontal lines across up to three timeframes.。
Highly recommended for busy working professionals and homemakers.
If you want to buy or are curious, please go to the product page via the link below!
<<<Koropokkuru - Automatic Horizontal Line Display>>>

【Introduction of product: 'Koropokkuru - Triple Moving Averages Display'】
The moving averages used for market analysis are displayed by the newly released indicator "Koropokkuru - Triple Moving Averages Display"!
This indicator is for those who are unsure about how to introduce and use moving averages.
Have you ever studied or practiced FX or stock market analysis or trading and considered introducing moving averages?
If so, you may have had concerns like the following:
・You tried introduced moving averages but can't determine the best values to set for parameters, especially the "period".
・You introduced too many moving averages and don't know what's correct... want to reset the overuse!
・Some sites show one moving average while others show five— which is correct?
・You tried implementing moving averages in your own way but aren't sure if it's right.
This indicator solves all those problems!
If you want to buy or are curious, please go to the product page via the link below!
<<<Koropokkuru - Triple Moving Averages>>>

We are also active on Twitter, so please follow us!
<< Yururi mo Yururi’s Twitter >>

【Lastly】
Thank you for reading this blog until the end!
We hope it will be helpful for your asset management.