【Dollar/Yen/Euro/Yen/Pound/Yen】Market analysis for Thursday, April 9, 2020
【Dollar/Yen/Euro/Dollar/ Pound Yen】Market Analysis for Thursday, April 9, 2020
Good morning, everyone! This is Yururi mo Yururi.
Thank you very much for visiting this blog.
Market analysis for Thursday, April 9, 2020has been updated on the blog.
The three currency pairs: Dollar/Yen, Euro/Dollar, and Pound/Yenare described.
Please take a look!
<<【Dollar/Yen/Euro/Dollar/Pound/Yen】Market Analysis for Thursday, April 9, 2020>>

We have started selling a new indicator series “Koropokkuru - Angle is King Series”!
An indicator that displays signals with a focus on the angles of MACD and OsMA.
Standard Version, Early Version are available.
Please take a look!
<<【4 Types Best Set】 Koropokkuru - Angle is King Series >>
☆ Now on sale at a special price for a limited time and quantity ☆
We have published backtest results of the indicators.

We also publish information for other currency pairs and timeframes, so please refer to it.
<<Koropokkuru - Angle is King Series— Standard Version Early Version Backtest Results>>
We have also written about this week's market analysis on the blog. If you haven't read it yet, please take a look.
<<【Dollar/Yen/Euro/Dollar/Pound/Yen】Market Analysis for April 6–April 10, 2020>>
【Backtest of Koropokkuru Series Indicator】
This is a video of backtesting the indicator for last week (March 23–27, 2020).
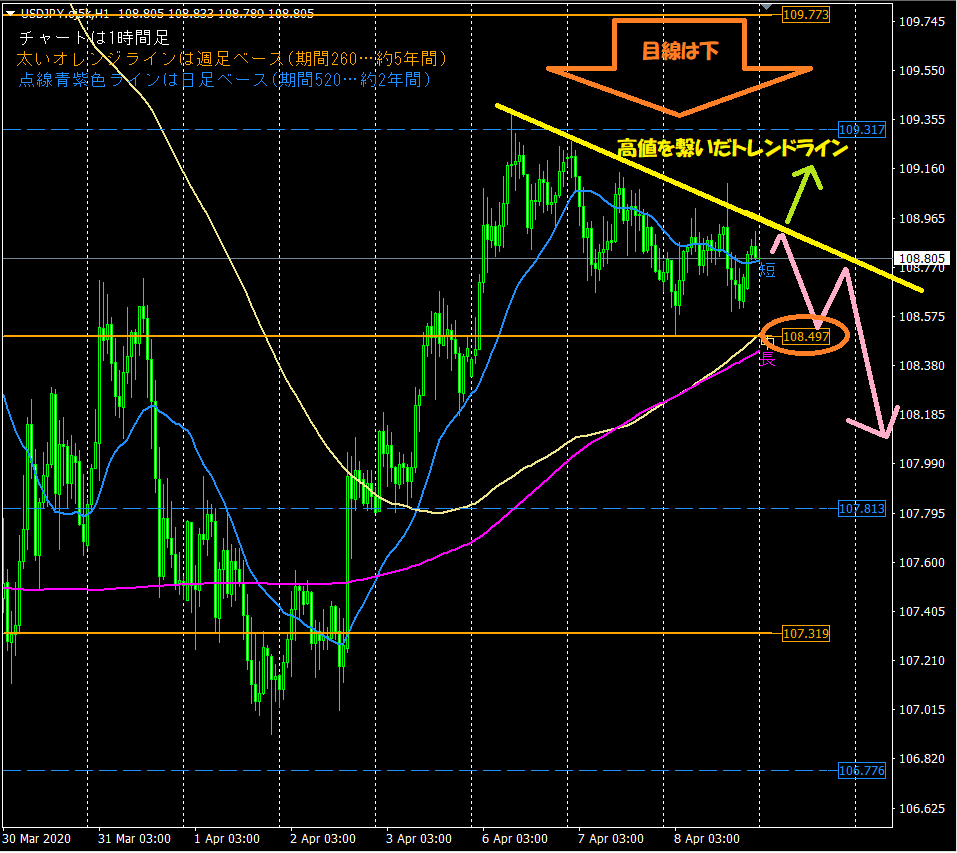
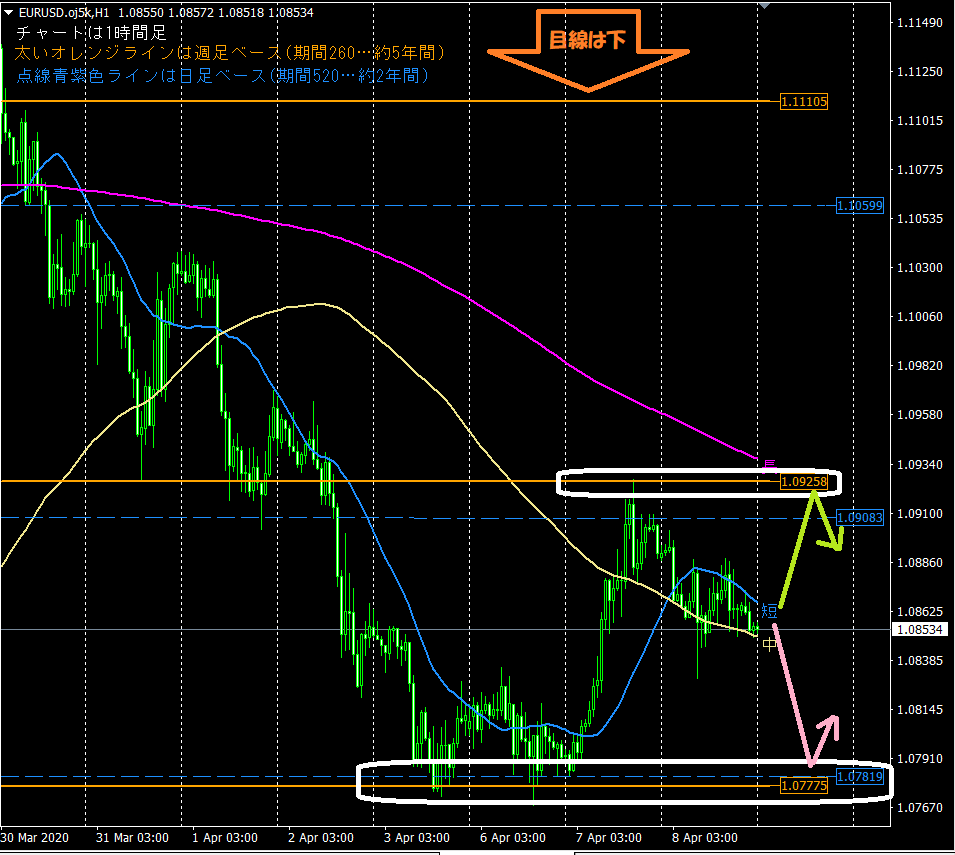
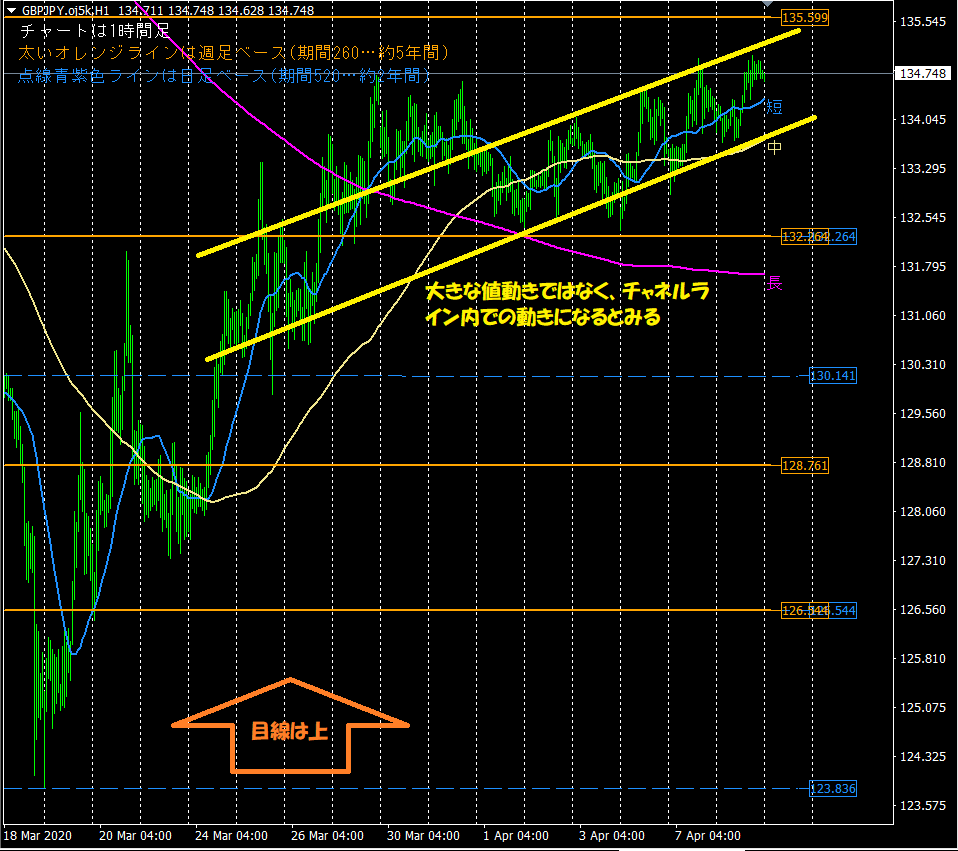
This is the hourly chart used in the blog's daily chart analysis. The two points to watch are below.1. The horizontal lines automatically displayed by the indicator function as support/resistance
⇒ Thick orange line (weekly basis period 260… 5 years), purple dashed line (daily basis period 520… 2 years)
2. Moving averages optimized for the hourly chart are often in use
⇒ Especially the short-term line (period 24… 1 day) and the long-term line (period 480… 1 month)
【Introduction of the Product for Sale “Koropokkuru – Auto Display of Horizontal Lines”】
The indicator used for market analysis automatically displays horizontal lines to reduce trading burden and was created with that aim.
It analyzes the highest and lowest prices within the specified period by price range and automatically displays up to three optimal horizontal lines across three timeframes..
Highly recommended for busy office workers and homemakers.
If you want to purchase or are curious, please go to the product page from the link below!
<<<Koropokkuru – Auto Display of Horizontal Lines>>>

【Introduction of the product for sale “Koropokkuru – Triple Display of Moving Averages”】
The moving averages used in market analysis are shown by the newly released indicator “Koropokkuru – Triple Display of Moving Averages”!
This indicator is aimed at those who are worried about introducing and using moving averages.
Have you ever analyzed FX or stocks or studied trading and considered introducing moving averages?
In such cases, you may have had the following concerns.
・You introduced moving averages but don’t know the best values to set in parameters—especially the “period.”
・You introduced too many moving averages and don’t know what’s correct… you want to reset the overuse!
・Different sites use 1, 5, or other numbers of moving averages—how many are correct?
・You tried implementing moving averages in your own way and are unsure if it’s correct.
This indicator solves all of those worries!
If you want to purchase or are curious, please go to the product page from the link below!
<<<Koropokkuru – Triple Display of Moving Averages>>>

We are active on Twitter as well, so please follow us!
<< Yururi mo Yururi Twitter >>

【Finally】
Thank you for reading this blog until the end!
We hope it helps with your asset management.