
【FX専業トレーダー猫のポンド円トレード解説0407】
This is the pound-yen after the employment statistics week.
First, let's take a look at the weekly chart.
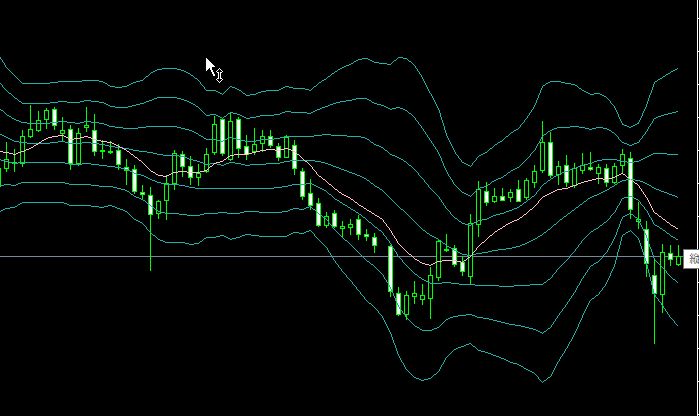
Both the middle band and the moving average are downward-sloping, and the angle remains steep. The bands are expanding, indicating momentum. Expansion also implies overbought and oversold conditions, so caution is always required. On a weekly level, the trend is undoubtedly bearish.
Next is the daily chart.
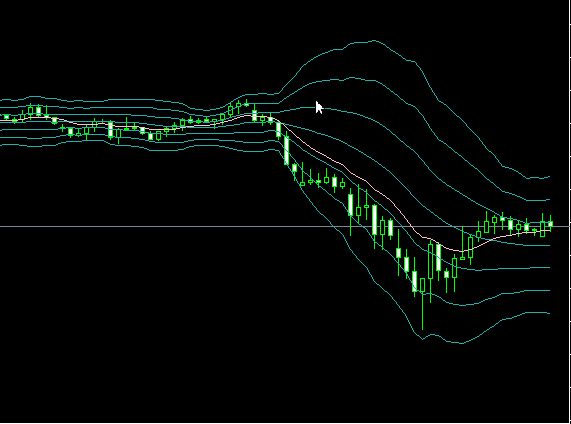
The middle band has become completely horizontal. The moving average is mildly upward-sloping. On the daily level, the market shows a strong tendency to range. In this state, there is a high probability of oscillating between the upper and lower 2 standard deviations. It is not a clean back-and-forth movement; each cycle forms a unique, complex pattern. And even though it’s a range, this volatility means a meaningful trend can emerge on a 4-hour chart. When this happens, you must be careful when prices touch the daily-band.
This is the 4-hour chart.
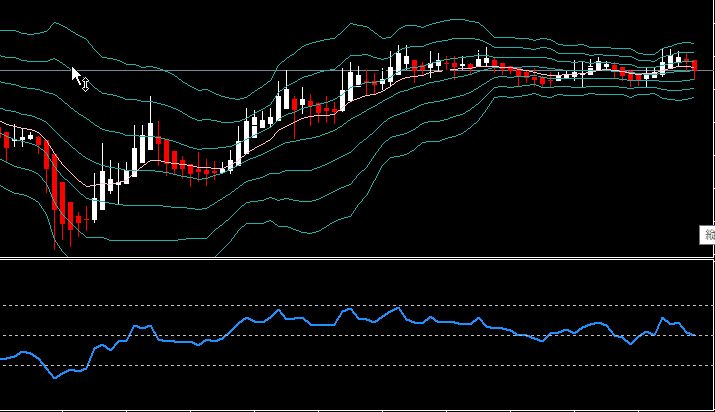
The range continues and it tested higher once, but it turned into a deceptive expansion. It remains a range, but the middle band is also slightly upward and RSI is held at 50, so at present it can be considered mildly bullish.
Carefully discern the direction and discard random rewards from the market to achieve victory with a necessary, decisive move.
[Attack is the best defense] The N-Method that delivers huge profits is here ↓↓
https://www.gogojungle.co.jp/tools/ebooks/22300