【Dollar/Yen / Euro/Yen / Pound/Yen】Market analysis for Friday, April 3, 2020
【USD/JPY/ EURUSD/ GBPJPY】Market analysis on Friday, April 3, 2020
Good morning, everyone! This is Yururi mo Yururi.
Thank you very much for visiting this blog.
Blog update on market analysis for Friday, April 3, 2020covering the analysis of three currency pairs: USD/JPY, EUR/USD, and GBP/JPY.
Please take a look!
<<【USD/JPY/EURUSD/GBPJPY】Market Analysis for Friday, April 3, 2020>>

I also wrote about this week's market analysis on the blog. If you haven't read it yet, please take a look.
<<【USD/JPY/EURUSD/GBPJPY】Market analysis from March 30 to April 3, 2020>>
【Indicator Koropokkuru Series Backtest Implemented】
This is a video of backtesting the indicator for last week (March 23–27, 2020).
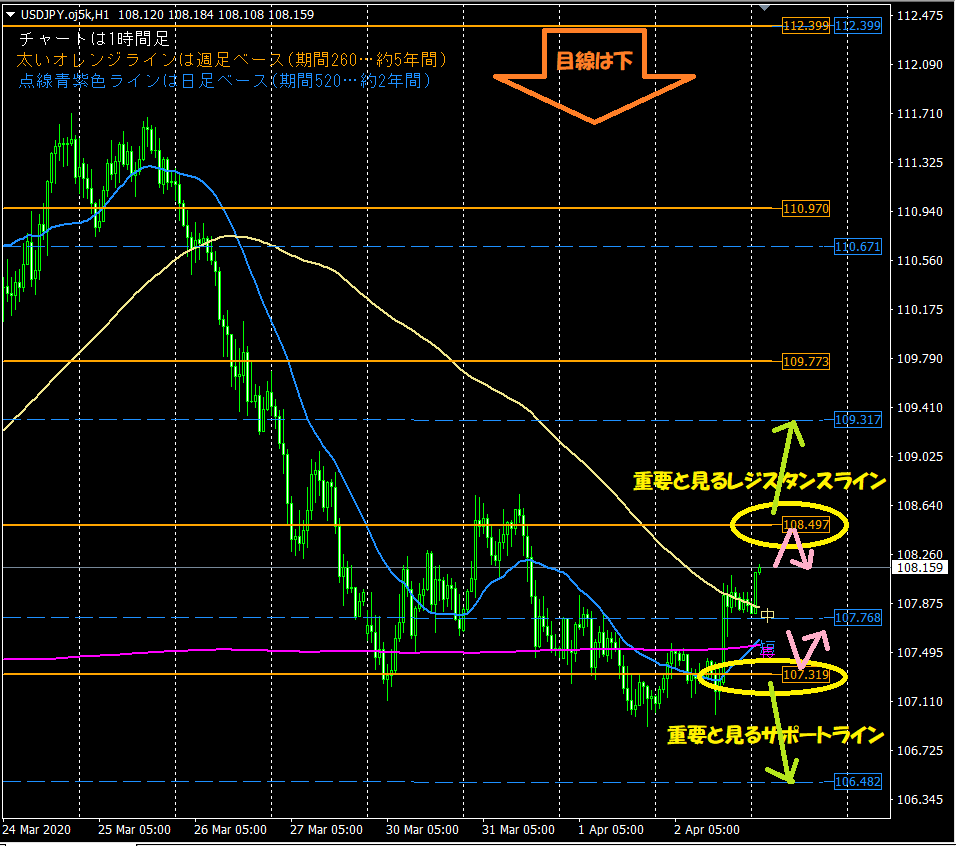
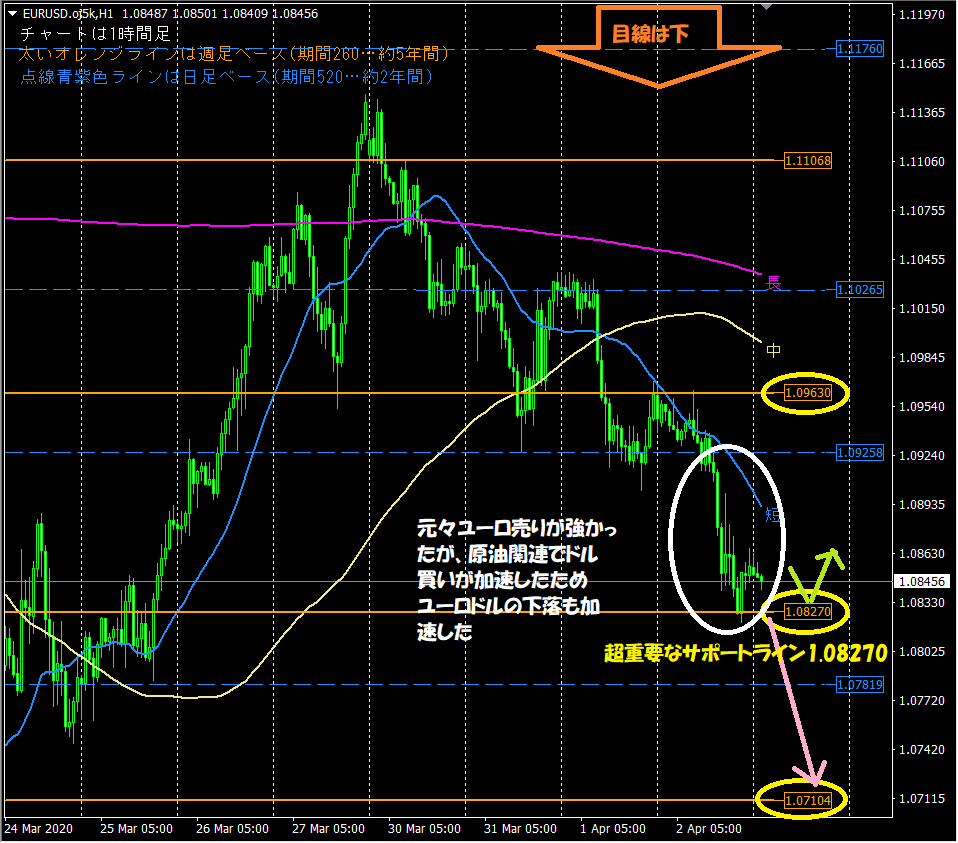
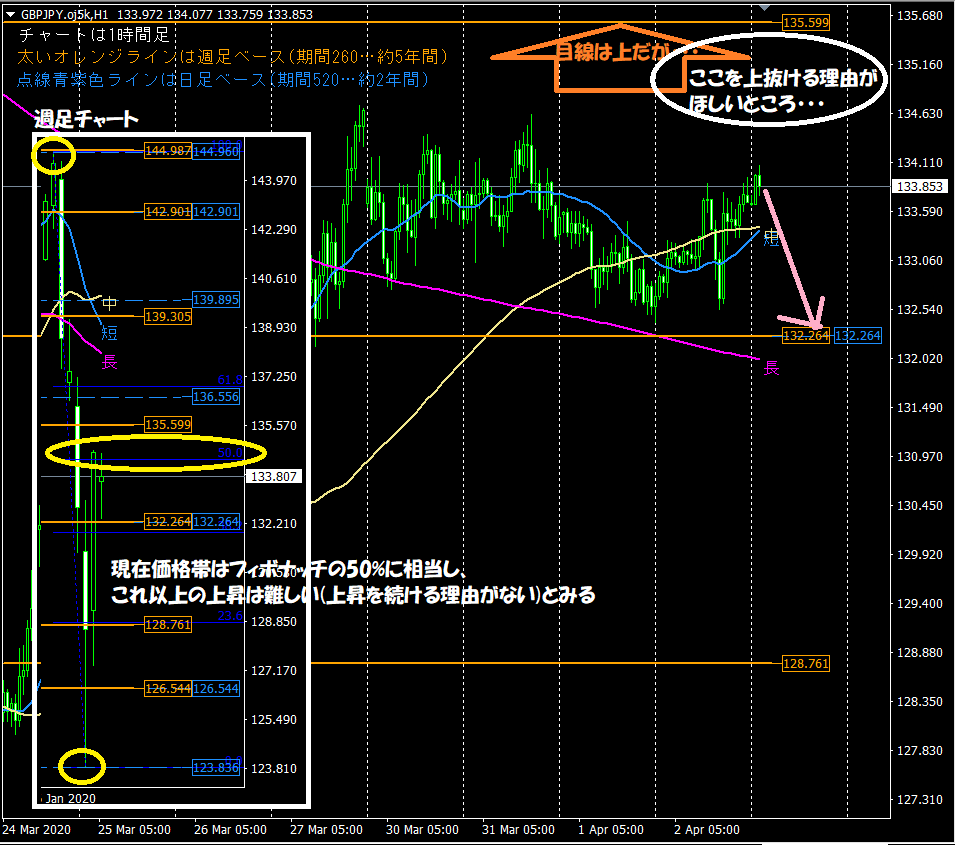
This is the 1-hour chart I use in the blog's chart analysis every morning. Key points to look at are the following two:1. The horizontal lines automatically displayed by the indicator function as support/resistance
⇒ Thick orange line (weekly basis 260 period… 5 years), purple dashed line (daily basis 520 period… 2 years)
2. Moving averages optimized for the 1-hour chart are frequently respected
⇒ Especially the short-term line (period 24… 1 day) and the long-term line (period 480… 1 month)
【Introduction to the On-Sale Product 'Koropokkuru – Automatically Display Horizontal Lines'】
The indicators I use for market analysis are designed to automatically display horizontal lines to reduce trading load. It aims to automatically display optimal horizontal lines across up to three timeframes..
It analyzes the highest and lowest price within a defined period by price bands and automatically displays up to three optimal horizontal lines across three timeframes.。
Highly recommended for busy days for office workers and homemakers.
If you want to buy or are just curious, please go to the product page from the link below!
<<<Koropokkuru – Automatically Display Horizontal Lines>>>

【Introduction to the On-Sale Product 'Koropokkuru – Triple Moving Average Display'】
The moving averages used in market analysis are displayed with the newly released indicator "Koropokkuru – Triple Display of Moving Averages"!
This indicator is aimed at people who are unsure about how to introduce or use moving averages.
Have you ever analyzed or traded FX or stocks and considered introducing moving averages?
If so, you may have had the following concerns:
・You tried introducing moving averages but don't know the best parameter values to set, especially the 'period'.
・You added too many moving averages and lost sight of what's correct… you want to reset the over-usage!
・Some reference sites show one moving average, others five— which is correct?
・You tried implementing moving averages on your own and feel unsure if it's right.
This indicator solves all of those concerns!
If you want to buy or are just curious, please go to the product page from the link below!
<<<Koropokkuru – Triple Display of Moving Averages>>>

We also are active on Twitter, so please following us!
<< Yururi mo Yururi on Twitter >>

【Finally】
Thank you for reading this blog until the end!
We hope it will be helpful for your asset management.