
FX dedicated trader cat's pound-yen trade commentary 0402
Since the moon has changed, let's look at the GBPJPY monthly chart.
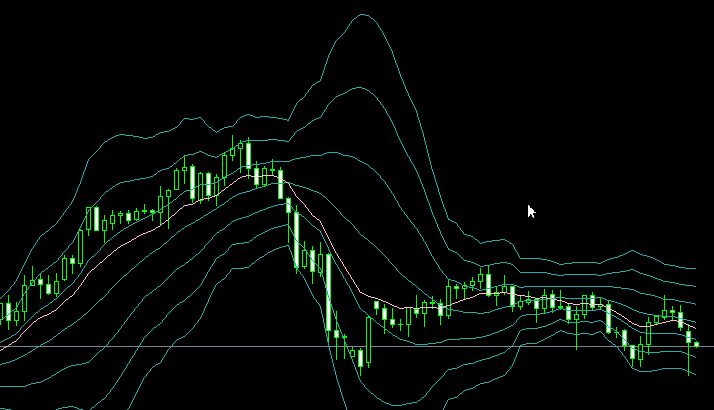
The Bollinger Bands have opened to the downside and the slope of the moving average has become steeper. It can still be considered bearish.
This is the weekly chart.
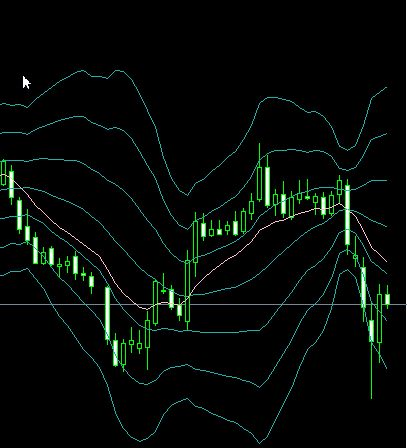
It is in a state of having retraced last week and moved down again. The bands remain expanded while the moving average angle is not flattening.
We remain bearish.
Next is the daily chart.
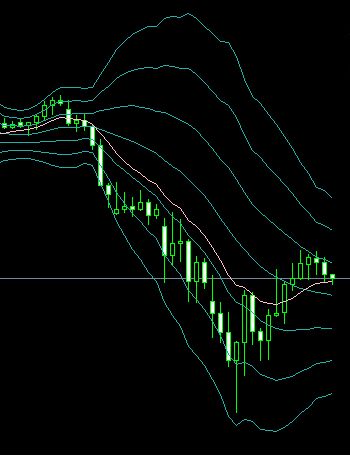
It bounced at 1 standard deviation. The middle band has not flattened, still sloping downward, and the rising angle of the moving average has become more gradual. There is ample room for further decline as well as for rise, making it a difficult situation.
In such cases, we ultimately judge on the lower time frame.
This is the 4-hour chart.
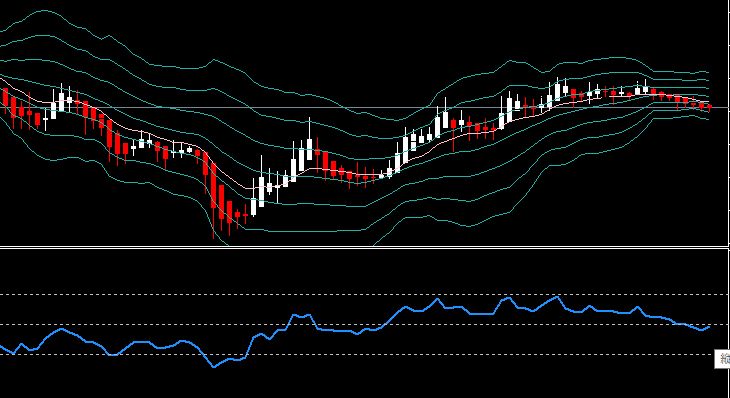
It is relatively squeezing. You can see that volatility is converging.
The moving average has started to slope downward, but the angle is very mild. RSI is below 50, indicating bearishness.
Because it’s relatively squeezing, a downside expansion is possible, but the absolute PIPS of the band width themselves isn’t that small, so a bounce and rise from the lower band is also quite possible.
Let’s consider possible scenarios and respond to the facts accordingly.
N-Method is here