【Dollar/Yen/Euro/Dollar】Market analysis for Thursday, April 2, 2020
【USD/JPY, EUR/USD, GBP/JPY】Market Analysis on Thursday, April 2, 2020
Good morning, everyone! This is Yururi mo Yururi.
Thank you very much for visiting this blog.
I updated a blog post about the market analysis forThursday, April 2, 2020.
The three currency pairs: USD/JPY, EUR/USD, GBP/JPYare covered.
Please take a look!
<<【USD/JPY, EUR/USD, GBP/JPY】Market Analysis for Thursday, April 2, 2020>>

I also wrote this week’s market analysis on the blog. If you haven’t read it yet, please take a look.
<<【USD/JPY, EUR/USD, GBP/JPY】Market Analysis for March 30 - April 3, 2020>>
【Backtest of the Colopockle Series Indicators】
This is a video of backtesting the indicators for last week (March 23–27, 2020).
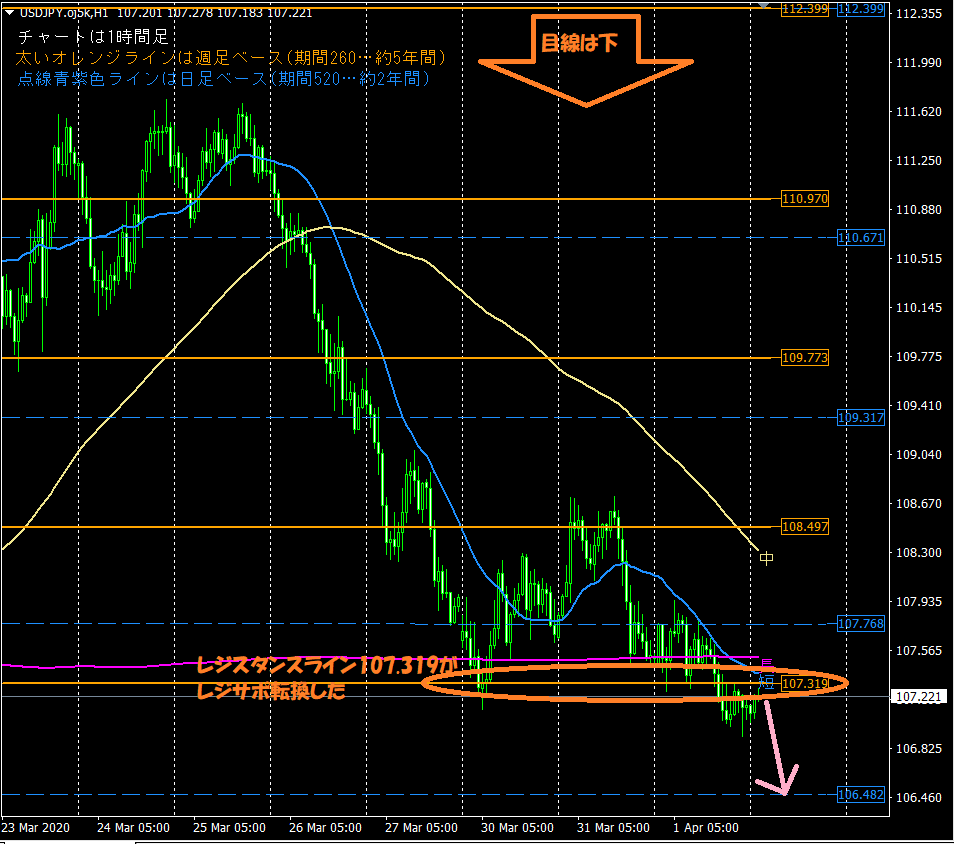
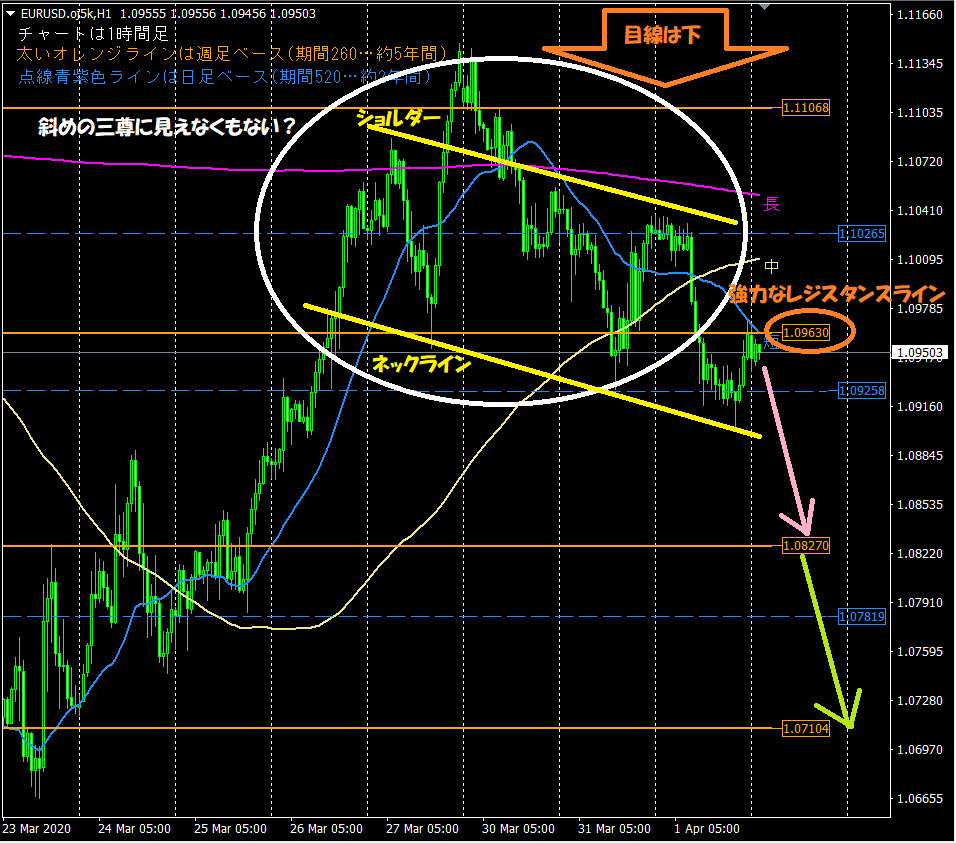
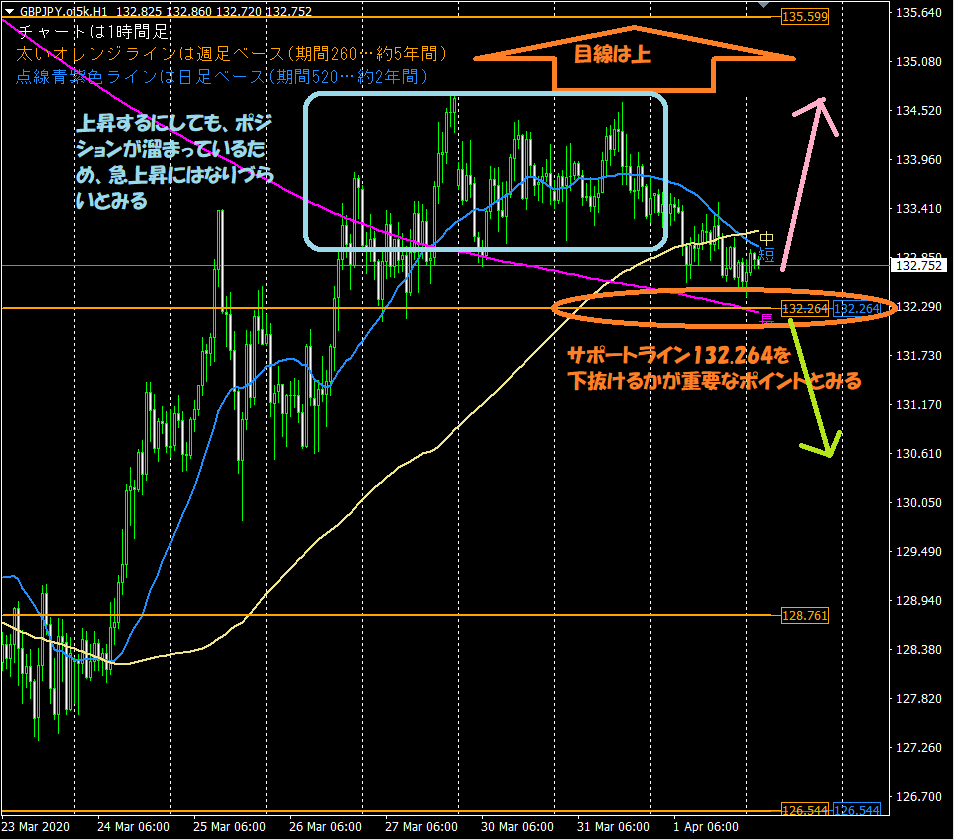
This is the hourly chart used in the blog’s daily chart analysis each morning. The two points you should look at are listed below.1. The horizontal lines automatically displayed by the indicators function as support/resistance
⇒ Thick orange line (weekly basis, period 260… 5 years), purple dashed line (daily basis, period 520… 2 years)
2. The moving averages optimized for the hourly chart are frequently respected
⇒ Especially the short-term line (period 24… 1 day) and the long-term line (period 480… 1 month)
【Introduction to the product for sale: 'Colopockle ~ Automatic Horizontal Lines Display ~'】
The indicators used for market analysis are designed to automatically display horizontal lines to reduce trading load. They are created to help by automatically displaying optimal horizontal lines across up to three timeframes..
They analyze the highest and lowest prices within a set period by price range and automatically show the best horizontal lines across up to three different timeframes..
They are especially recommended for busy businessmen and homemakers.
If you would like to purchase or are simply curious, please go to the product page via the link below!
<<<Colopockle ~ Automatic Horizontal Lines Display ~>>>

【Introduction to another product: 'Colopockle ~ Triple Moving Averages Display ~'】
The moving averages used in market analysis are shown by the newly released indicator “Colopockle ~ Triple Moving Averages Display ~”!
This indicator is aimed at those who are puzzled about implementing moving averages or how to use them.
Have you analyzed or studied markets such as FX or stocks and considered introducing moving averages?
If so, you may have had concerns like the following:
・Tried implementing moving averages but can’t determine the best values for the parameters, especially the 'period'.
・Took on too many moving averages and lost clarity… want to reset to a simpler setup!
・Some sites show 1 moving average while others show 5— which is correct?
・Implemented moving averages in my own way, but I'm not sure it's correct.
This indicator can resolve all those concerns!
If you would like to purchase or are simply curious, please go to the product page via the link below!
<<<Colopockle ~ Triple Moving Averages Display ~>>>

I’m also active on Twitter, so please follow me!
<< Yururi mo Yururi Twitter >>

【Finally】
Thank you for reading this blog until the end!
I hope it helps with everyone’s asset management.