【FX・CFD・仮想通貨】Fundamental Principles of the Market Indicatorについて
Proposing a new idea indicator to discretionary traders who have not yet seen results
Even though you’ve taken positions...

That doesn’t mean you should study...

Because you’re tired from work
you can’t continue
You don’t have time
you can’t memorize
Up to now you’ve tried indicators...
Doesn’t feel right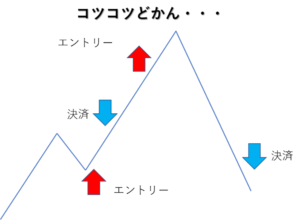
Still, you want to trade by discretion rather than system

If you have such worries
and aren’t achieving the results you want
The principle of market analysis indicators
can meet your expectations.
Even beginners can, with this indicator, obtain a technically correct exit scale.
Ah, that time I closed out at ●●, and it ran this far...
You’ve had that experience, right?
However, with a technical analysis-supported
exit scale,
such frustrating experiences will be drastically reduced.
Also, with indicators,
you can develop a consistent exit scaleand
the quality and efficiency of verification will improveand, as a result,
discretionary trading becomes much easier to win.
Then why?
Because the forecasts using technical analysis are
more stable and reproducible, right?
To get to the point: technical analysis is
data on human instinct-driven behavior..
The thrill of making large profits
the anxiety or fear when unrealized losses grow
the urge to lock in profits quickly
the impatience to recover losses...
When people feel these emotions strongly,
their instincts push them toward impulsive actions
the probability becomes very high.
When a crush comes near during adolescence, didn’t you sometimes act differently?
You try to control yourself, but
you can’t help it.
That’s it.
What’s been measured and analyzed as these human instinct-driven actions
is technical analysis.
Even beginners can know target values at the level of famous traders with one click!
It is not just about technical indicators
.
technical analysis is only a small part within technical analysis
.
Among the many technical analyses, if you ask what could be the weapon for a discretionary trader to win,
I would answer without hesitation: Elliott waves.
.
If you illustrate Elliott waves, it looks like this.
<Image of Elliott waves>

If you understand Elliott waves, you can say
“It seems the rise is about to stop and correct.”
“The correction seems to stop around here.”
Thus you can foresee the rhythm of market moves in advance..
And to some extent,you have a sense of how far it can move.
When I posted on a huge bulletin board,
using Elliott waves, I repeatedly hit the target during intraday moves.
The reason I could predict price moves so accurately was that I discovered the rhythm law of Elliott waves and became proficient in it by chance.
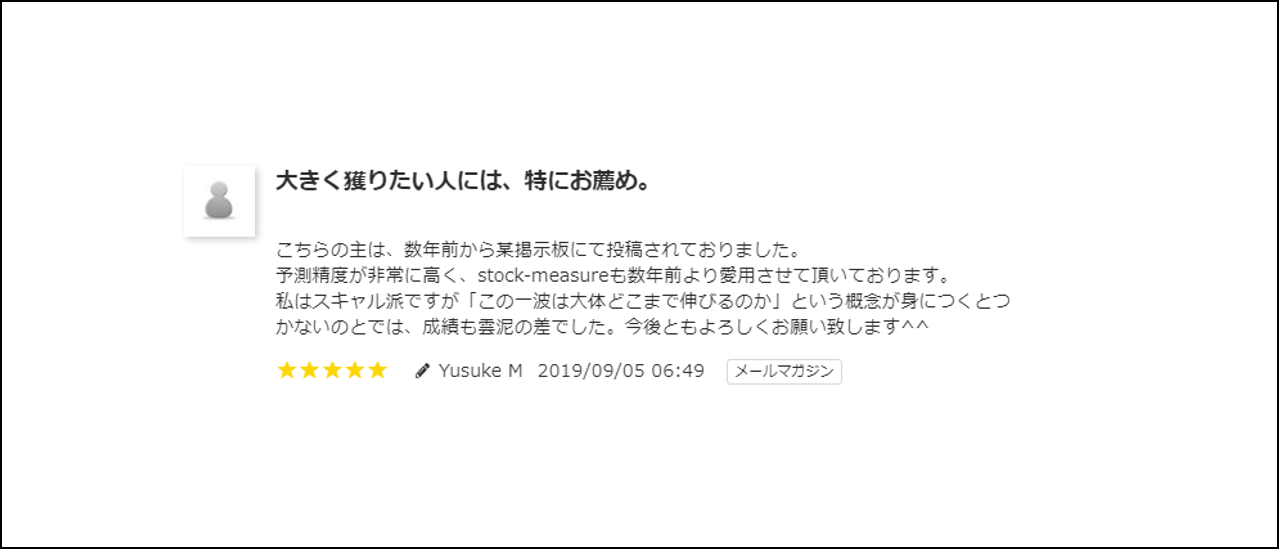
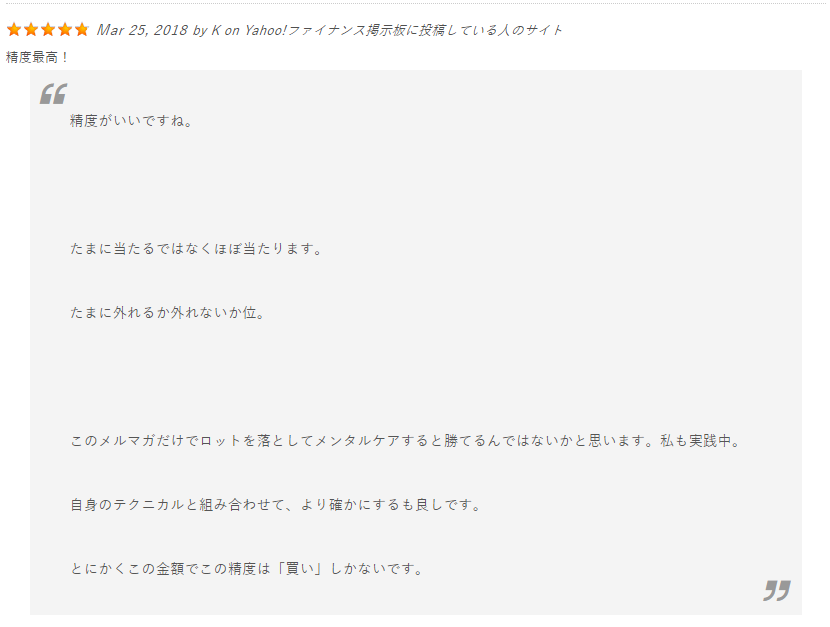
However, those posts were erased, so I’ll share reviews from people who knew those times.
Source: FX site Gogojan kinchanbbh3’s newsletter/reviews
(Stock-Measure is not currently for sale.)
*Contents are personal impressions only.

But the key question is
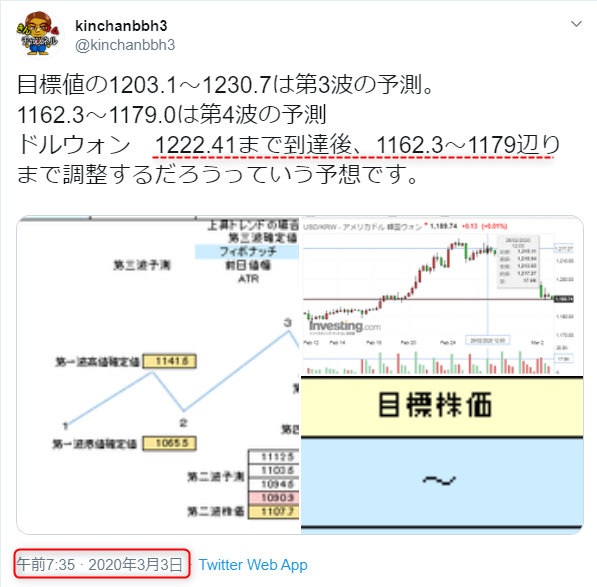
the level of price movement you can understand from the Elliott-wave law you accidentally discovered,
and how high a level that is?
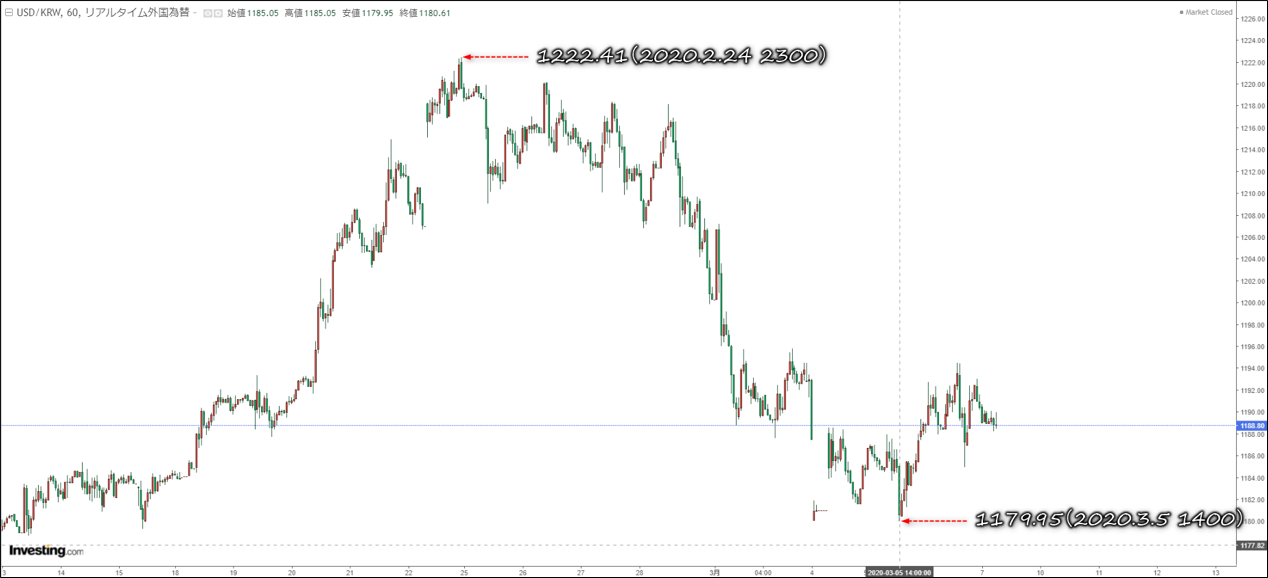
on Twitter, I predicted with concrete numbers the points where a correction would drop
The USD/KRW one-hour chart after the video was posted
The reason I, a former Self-Defense Forces member, could suddenly succeed in discretionary trading
Discretionary trading cannot win
If you think so,and you’re a discretionary trader trying to give up on winning,please read my experience.
For a long time from youth to middle age,
I was in the Self-Defense Forces,
where I developed depression due to a supervisor’s harassment,
and unexpectedly retired from the SDF, where I had planned to work until retirement.
I encountered a harassment supervisor during a transfer, and I ended up retiring...
Even though security was guaranteed as a Special Civil Servant until retirement,
the world can turn like this.
The next moment is unseen darkness.
In such a precarious situation,
my wife decided to support me.
Not a melodrama, but
if I didn’t feel motivated, I wouldn’t be a man.
Yet realistically I was a 40-something man with mental health issues.
Few companies would hire me,
and I doubted whether I could adapt to an organization.
So I turned my attention to stock day trading.
I had long been interested in stock investing since my time in the Self-Defense Forces,
and because I’m particular, I studied fundamentals thoroughly, reading ZAi and Shiikihou,
analyzing P/E, P/B, and the business content of the companies.
But even good earnings announcements could cause the stock to fall because of “good news already priced in,”
or rise due to “bad news already priced out.”
Reading analysts’ materials, I felt as if they knew in advance when earnings would be good or bad, and I wondered why.
Being naturally meticulous, I wanted to know why.
In researching, I learned that
analysts who analyze fundamentals often prepare two reports in advance:
if earnings are good, they issue a report stating the positive earnings were valued and stocks rose;
if earnings are good but there’s negative sentiment, they issue a report claiming the good earnings were priced out and stocks fell.
Even professionals who specialize in fundamentals cannot always tell whether earnings will lead to a rise or fall
If you do the market right, losses are minimized and profits are rewarded.
overtrading beyond proper risk
I happened to discover a certain pattern
felt excited every time I validated it
On a huge bulletin board, when I tried to predict price moves and posted, my predictions hit surprisingly well.
● I had meticulously kept trading records and knew my own trading expectancy.
The image above is my beginner-era trading records and lessons.
(Some parts contain know-how.)
you must use your knowledge, strategy, discipline, etc., against opponents on the other side of the PC screen with overall power.
In short,.
A crystallization of hard work and chance encounters with know-how
that isthe principle and rule indicator of the market.
Surpassing the conventional FX indicator wisdom! This is why it works! A new concept indicator
Previously, FX indicators circulated as signals that show arrows at entry and exit, focusing on timing of entries.Conventional indicator approach offered clarity, but trading itself would depend on the internal logic of the indicator, and a discretionary trader would have to decide which indicator signals to ignore, meaning
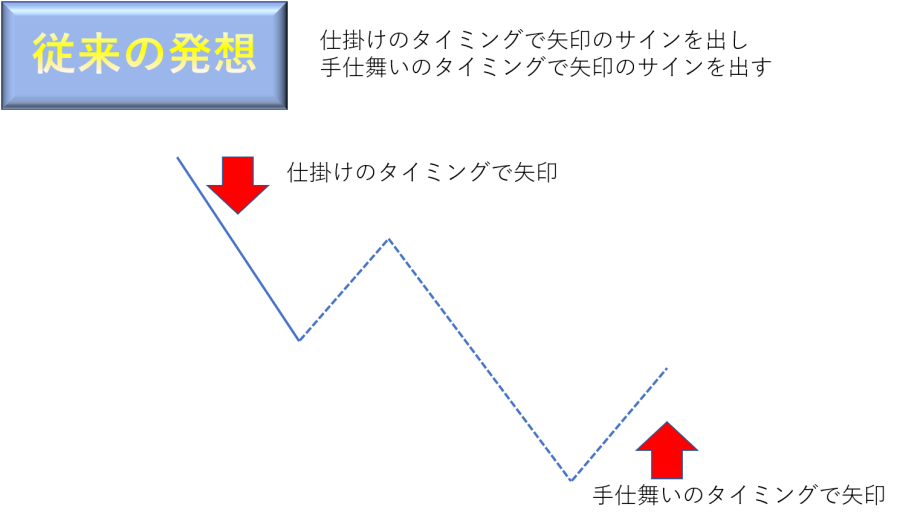
the indicator would stop working once it stops being valid.
Also,※1risk-reward could not be known in advance, so there was no standard for what win rate yields a positive expectancy.
Therefore, no matter how many trading journals you keep,the expectancy cannot be known, and it’s hard for discretionary traders to sustain consistent profits.
So, what about automated trading?For example, consider an EA with 99% win rate
and PF 2.0.
That requires maintaining win rate well above 99 to avoid capital drawdown.
50 wins, 1 loss at break-even, i.e.,over 98% win rate is necessary to avoid capital loss.
Risk-reward is calculated as risk 1 to reward 0.02.
Think carefully.
2000 yen profit at 100,000 yen risk
20,000 yen profit at 1,000,000 yen risk
Almost all EAs that claim PF2.0 arecurve-fitted.
Under that,can you keep such a high win-rate?You understand, right?
So, how can discretionary traders continue to win?A change of mindset is needed.
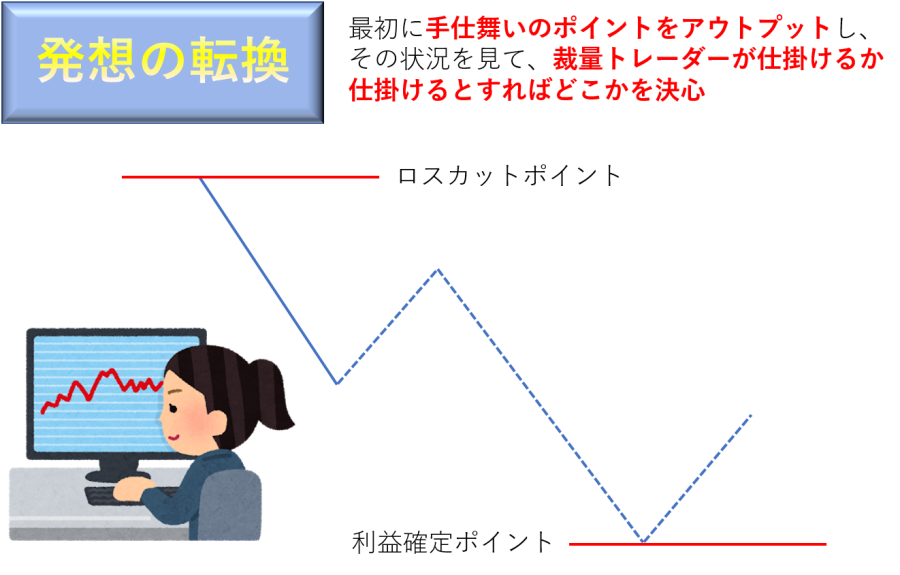
New conceptMarket principle indicator.
First,the exit point is output on the MT4 chart.
Also,you can pre-recognize risk-reward based on the entry point,and with consistent exit precision you can reap the benefits of a trading journal.
As data accumulates, the precision of expectancy increases, enabling discretionary traders to improve their odds of spotting opportunities.
Also, unlike high-win-rate EAs,if you balance win rate with risk-reward and trade with discipline, you can win with even a 50% win rateand still make a profit.
Professional traders prioritize controlling risk over winning rate.
the probability of keeping profits is higher

|
Because it’s a type of indicator that has never existed before the synergy with quality information products ispossible |
a completely reverse starting point from conventional thinking that supports discretionary traders
with a new indicator.
In other words, investing in already purchased indicator-based information products won’t be wasted, and there is potential for a synergistic effect.Possible synergy benefits
Why I released the Market Principles Indicator
And similarlythe market also has principles.
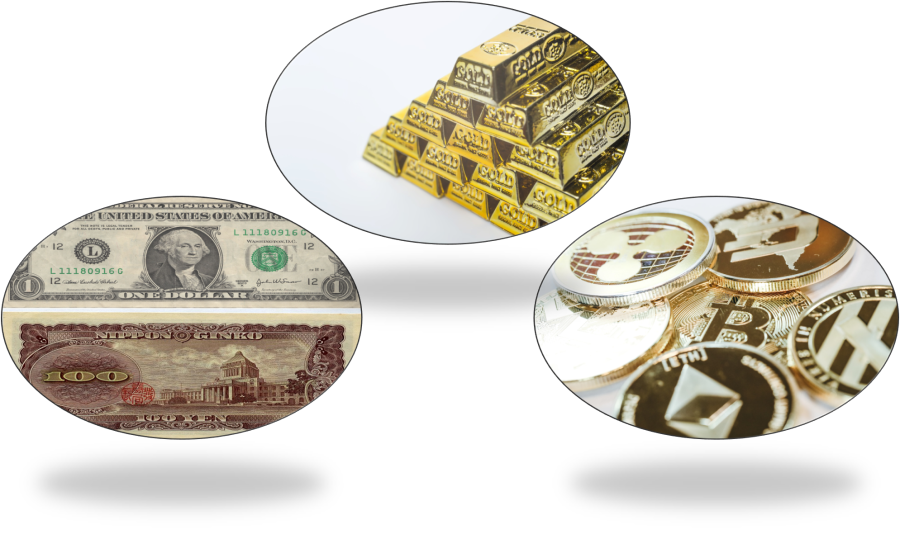
That is,whether you invest in stocks, FX, commodities, futures, or crypto, it does not change.
I relied on reproducibility of logic to win, and

These are comments on a YouTube channel that are more credible than typical product reviews.
“Is it okay to release such a powerful logic to the world? Won’t reproducibility deteriorate?” people often ask.
However,technical analysis has gained widespread acceptance globally and has stood the test of time,and its reproducibility has not declined at all
.
With hundreds of millions trading with technical analysis
Here,no matter whether hundreds, thousands, or tens of thousands use this logic, nothing changes.
If so, I believe it is a societal loss not to bring a tool to the world that could alleviate many people’s future financial anxieties.
| In the widely followed newsletter, there is a high rate of accuracy and hits |
◆ USD/JPY four-hour chart Output target values in advance
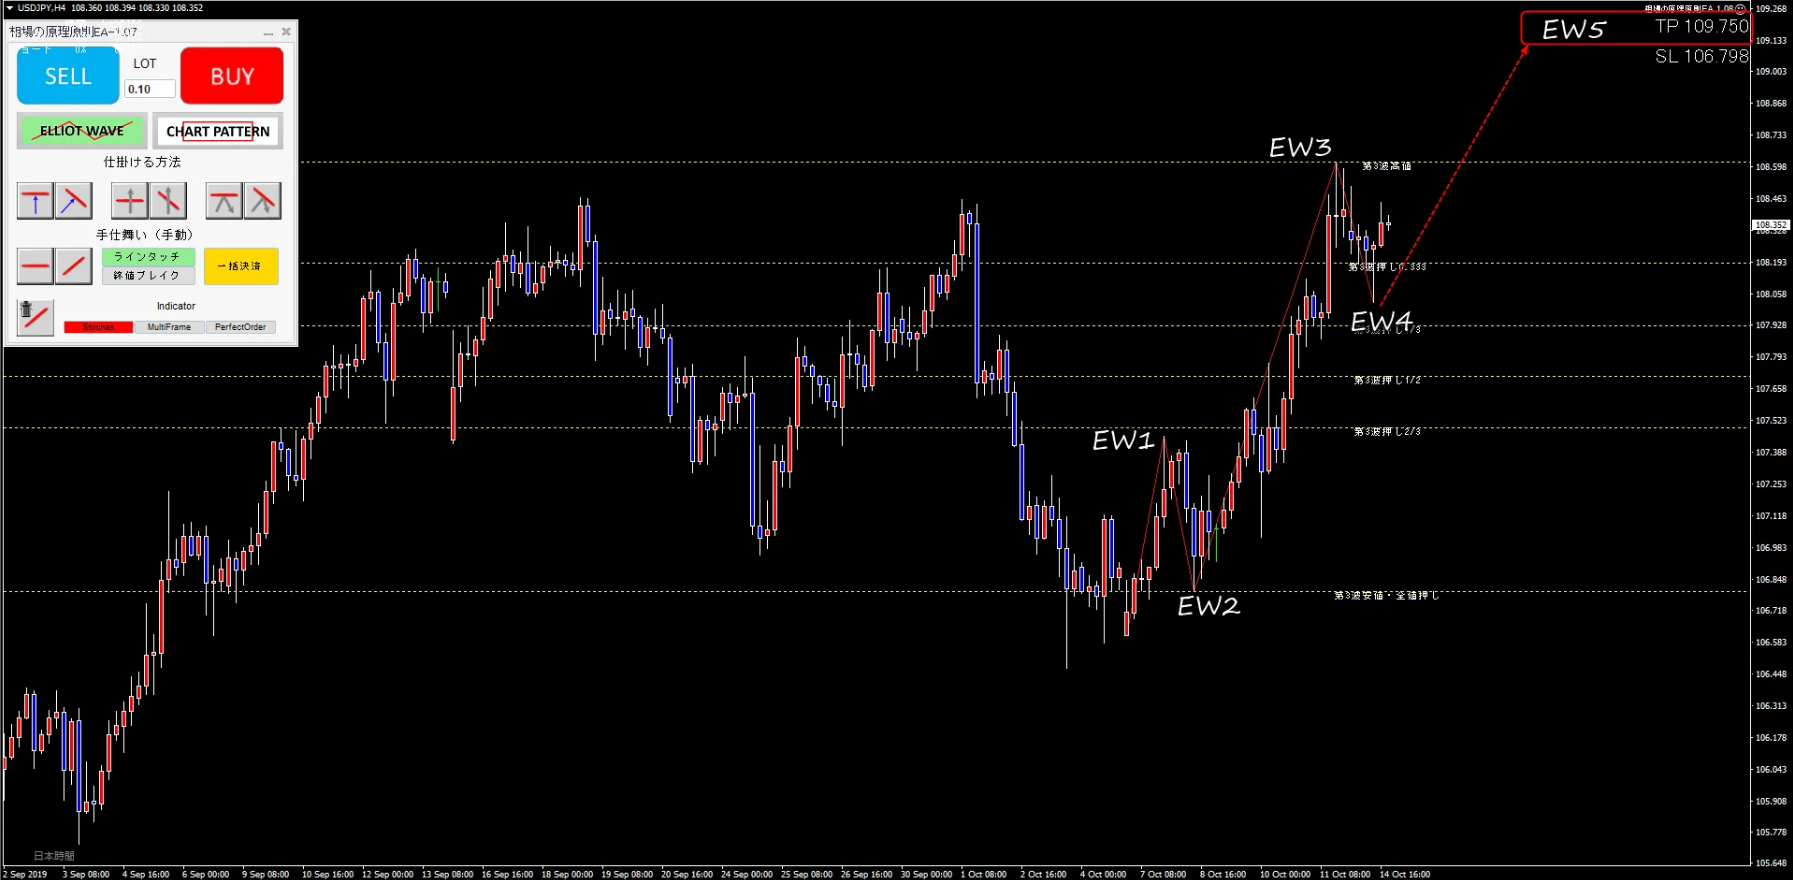

◆ USD/JPY four-hour chart Result 108.352⇒109.720
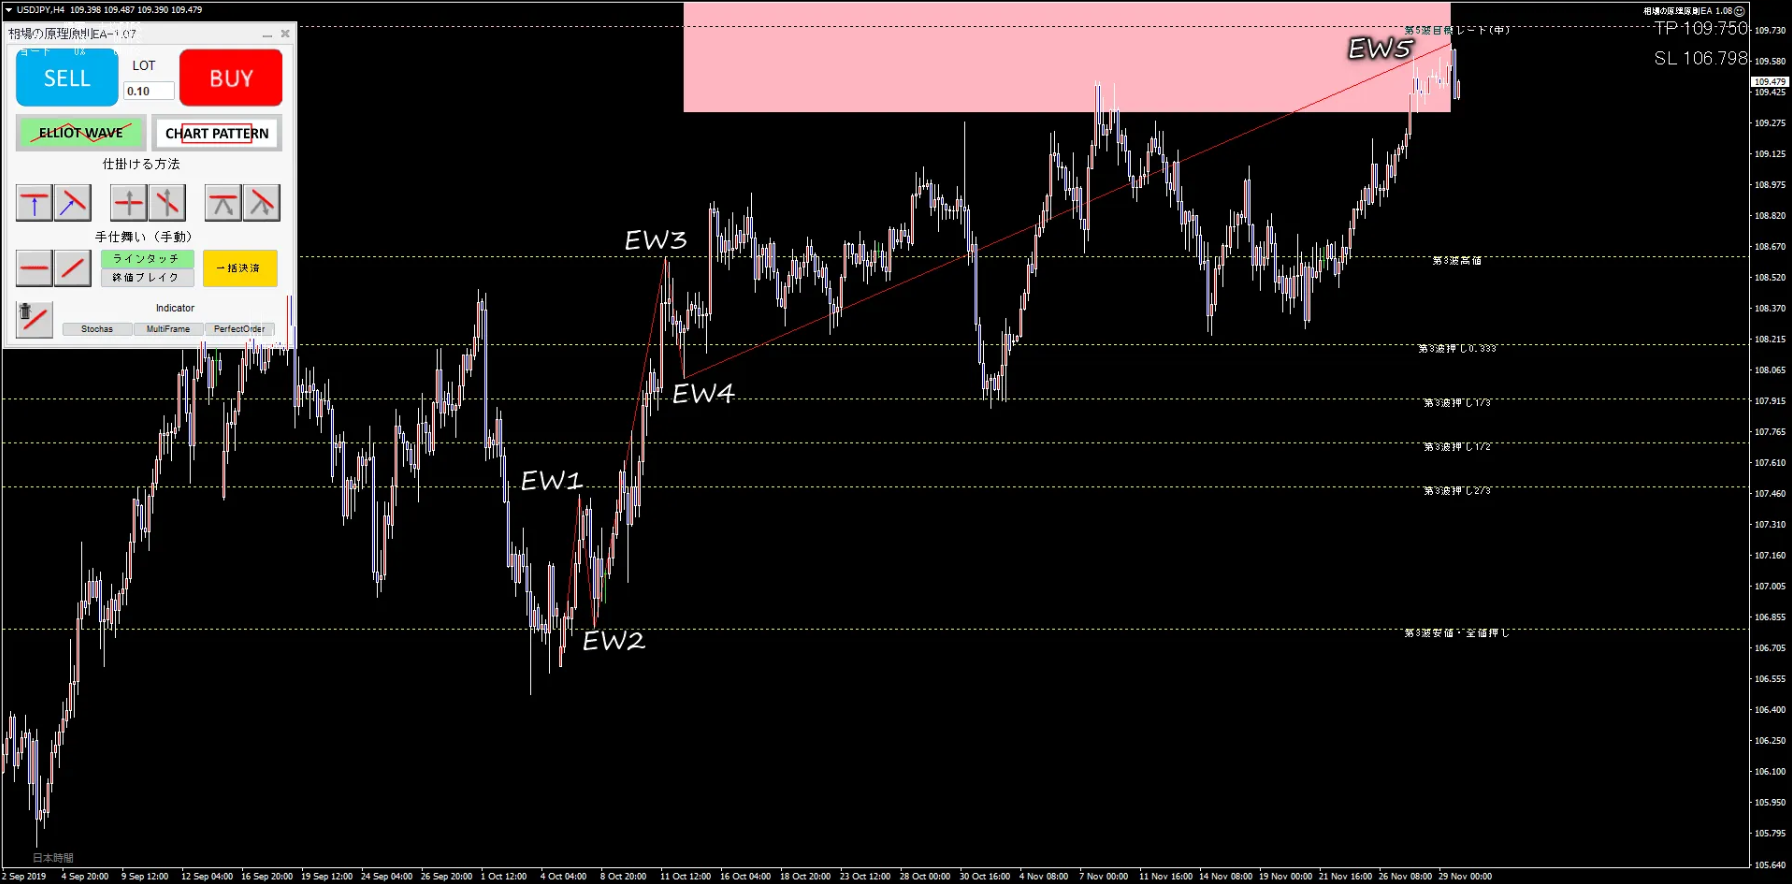
※ Tools in images are not the Market Principle Indicator but EAs using the same calculation logic.
| Pound-yen movement also moved greatly… |
◆ GBPJPY 15-minute chart Output target values in advance
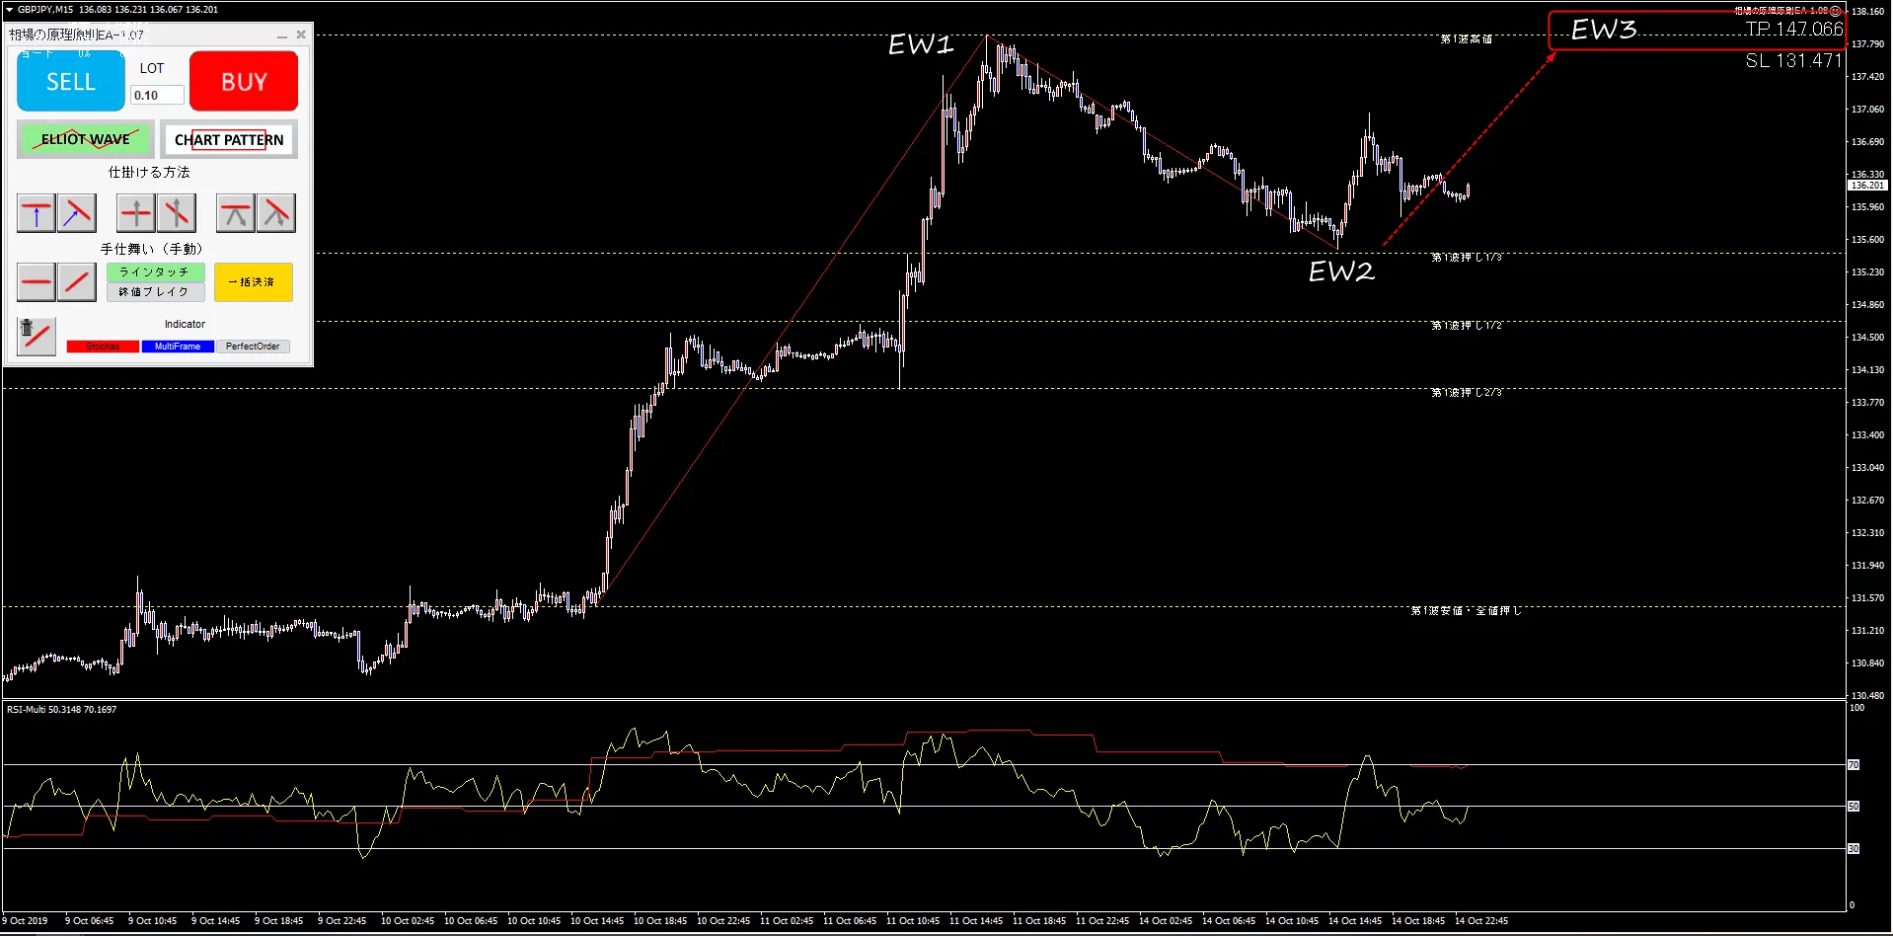
◆ GBPJPY 15-minute chart Result 136.200⇒147.945
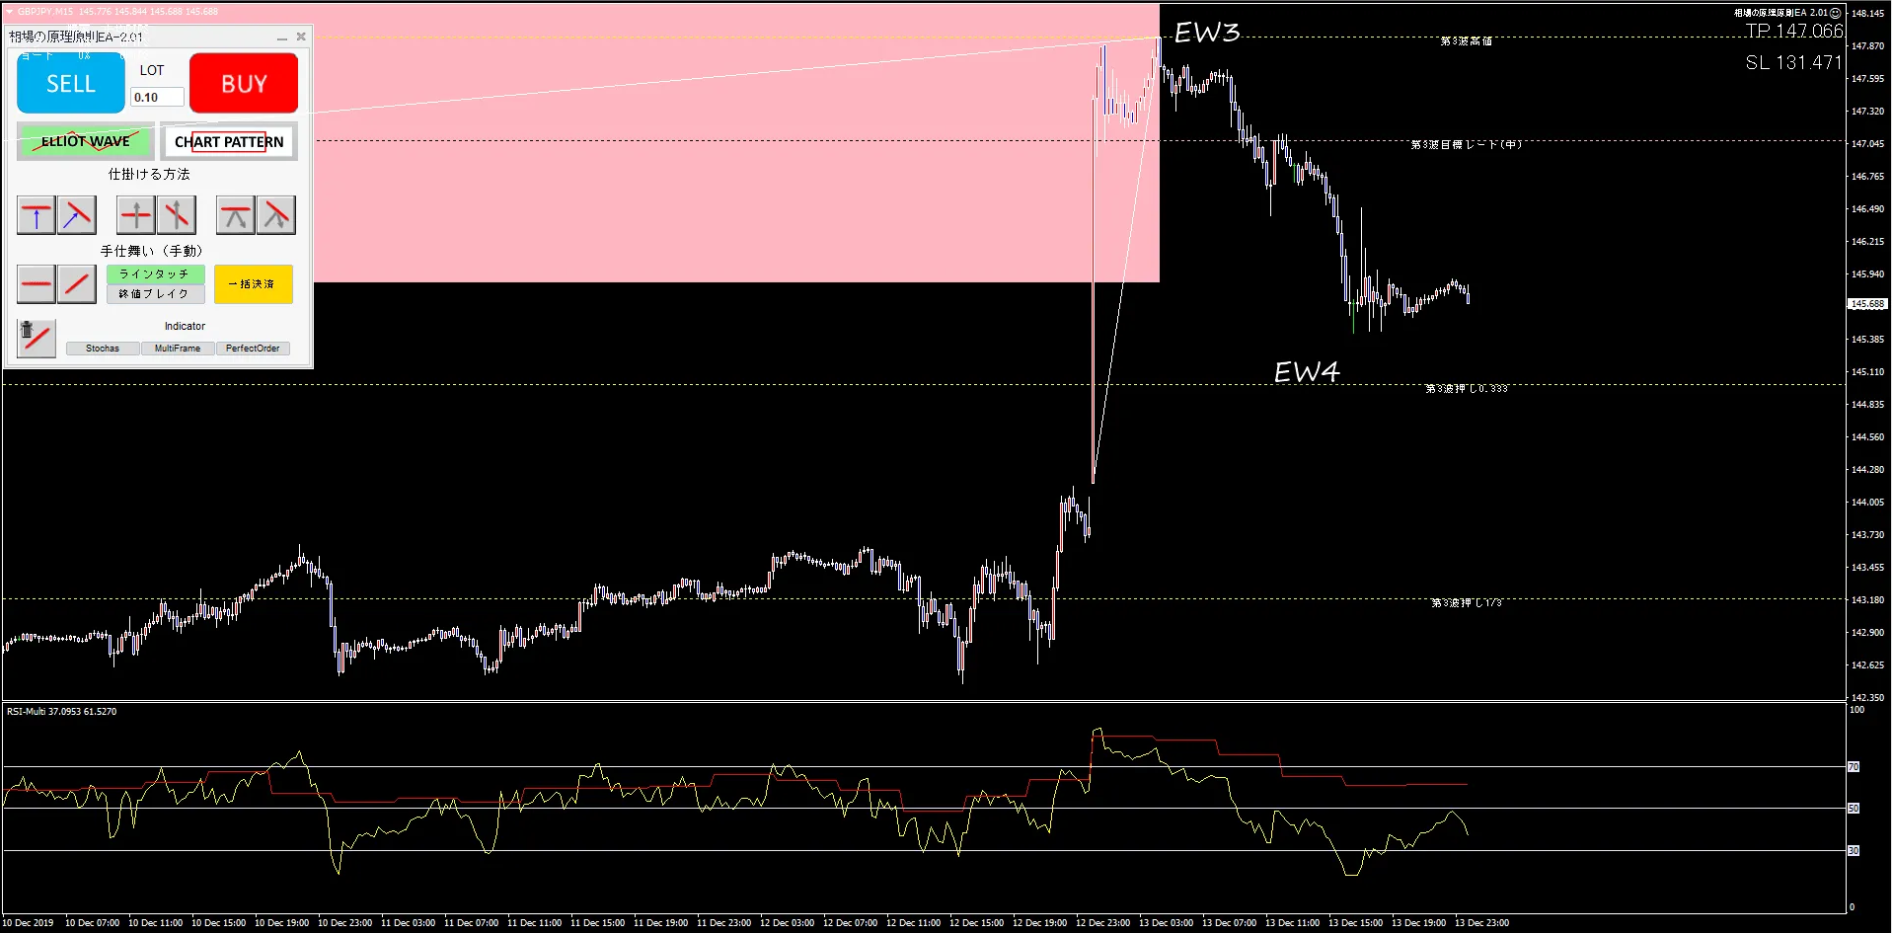
※ Tools in images are not Market Principle Indicator but EAs using the same calculation logic.
The newsletter has been utilized by over 1,000 people, and despite no affiliate rewards, the average reviews are nearly perfect.


| Trader cases with Elliott wave third-wave target values |

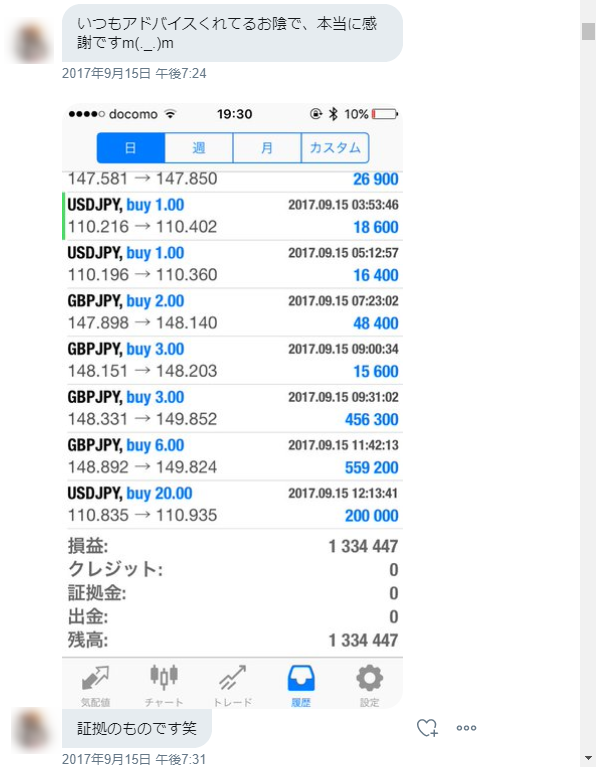
(Earlier generation of Market Principle Indicator, shared by Stock-Measure users via LINE.)
|
◆ Output Elliott wave target values with one click! |
| Discretionary Trader Support No.2 |
|
◆ Display Elliott wave Fibonacci retracements on the chart |
| Discretionary Trader Support No.3 |
|
◆ Recognizing flags, pennants, and minor consolidations outputs target values instantly |
| Discretionary Trader Support No.4 |
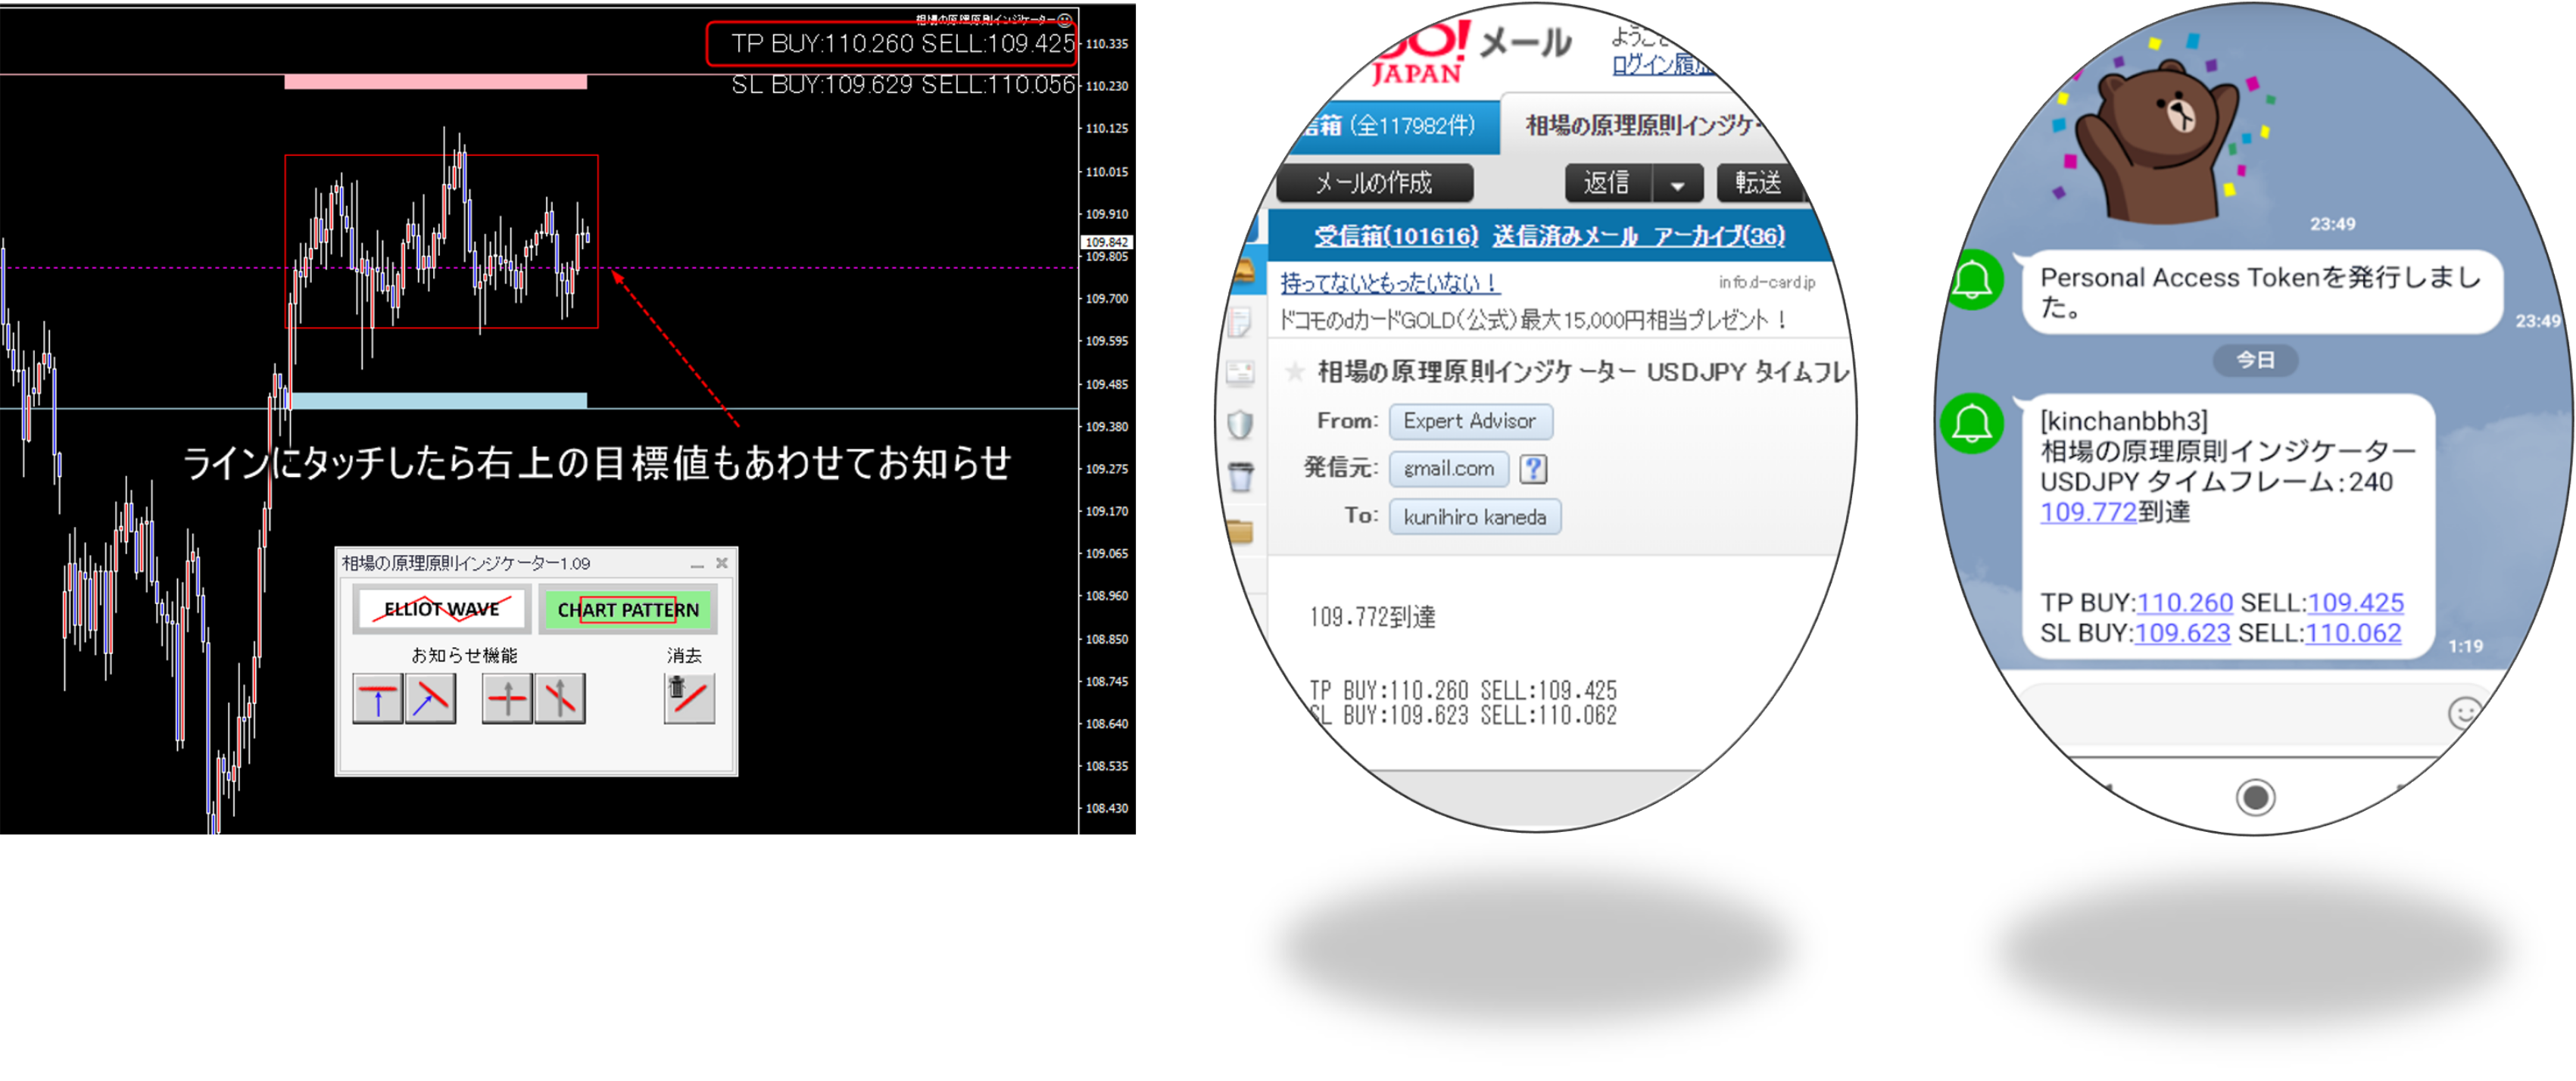
|
◆ Notify by LINE or email when the trader’s set trigger is reached |
| Discretionary Trader Support No.5 |
|
◆ Market-wide, FX, CFDs, and Bitcoin all-in-one |
The value of a market principle indicator packed with such high performance and know-how |
To reach the Market Principle Indicator, I went through tremendous trial and error.
Initially, I developed logic to automatically detect Elliott waves for automation.
However, I had no prior experience with automated trading EAs or indicators, so even writing a specification was challenging.
Because I don’t often use technical indicators in trading, explaining to a programmer how to detect the starting point of Elliott waves was extremely difficult.
Ultimately, I could not complete automatic detection of the Elliott wave starting point,
but to hire capable programmers drove up development costs.
Previously, with Stock-Measure, a similar indicator that outputs Elliott waves was released,
and though most of it was Excel-based with a portion outsourced,
the development cost was about 100,000 yen.
Even with such tools,
I priced it at 50,000 yen and demonstrated reproducibility on a major bulletin board,
which led to high praise and a ranking on Infotop’s stock education productsfor a period of time.
no keyboard input is required, and it can output targets for chart patterns like flags and pennants,which required nearly 100x higher development costs and time.
If you consider the value of my know-how and reproducibility, Stock-Measure, which once sold for 50,000 yen, sold well.
This time, however,
this time, specially...
29,800 yen
In any case, it’s a bargain.
If you pay in 8 installments, it’s about 125 yen per day.
125 yen per day is the price of a can of coffee.
| Special |
①Full refundGuarantee
※【Return eligibility】
For three months after first purchase, if you use it as instructed and in all trades including wins and losses,
the third-wave target zone reaches only 25% or less, and if there is no reproducibility,
you may apply by email within 90 days after the three-month practical period for a full refund to your account.
Because I have confidence in reproducibility, this is a guarantee.
※ MT4 account history is required. (Demo accounts and second-time purchases are excluded.)
【Return timing】
Refund is possible if you contact us within 90 days after the practice period.
【Return method】
Please request a refund by email.
We will transfer the purchase price to the specified account within 30 days.
② 90 daysUnlimited email support
For 90 days from purchase, if you have questions about Elliott wave derivation, chart pattern outputs, MT4 integration, etc., we will provide unlimited, thorough email support.
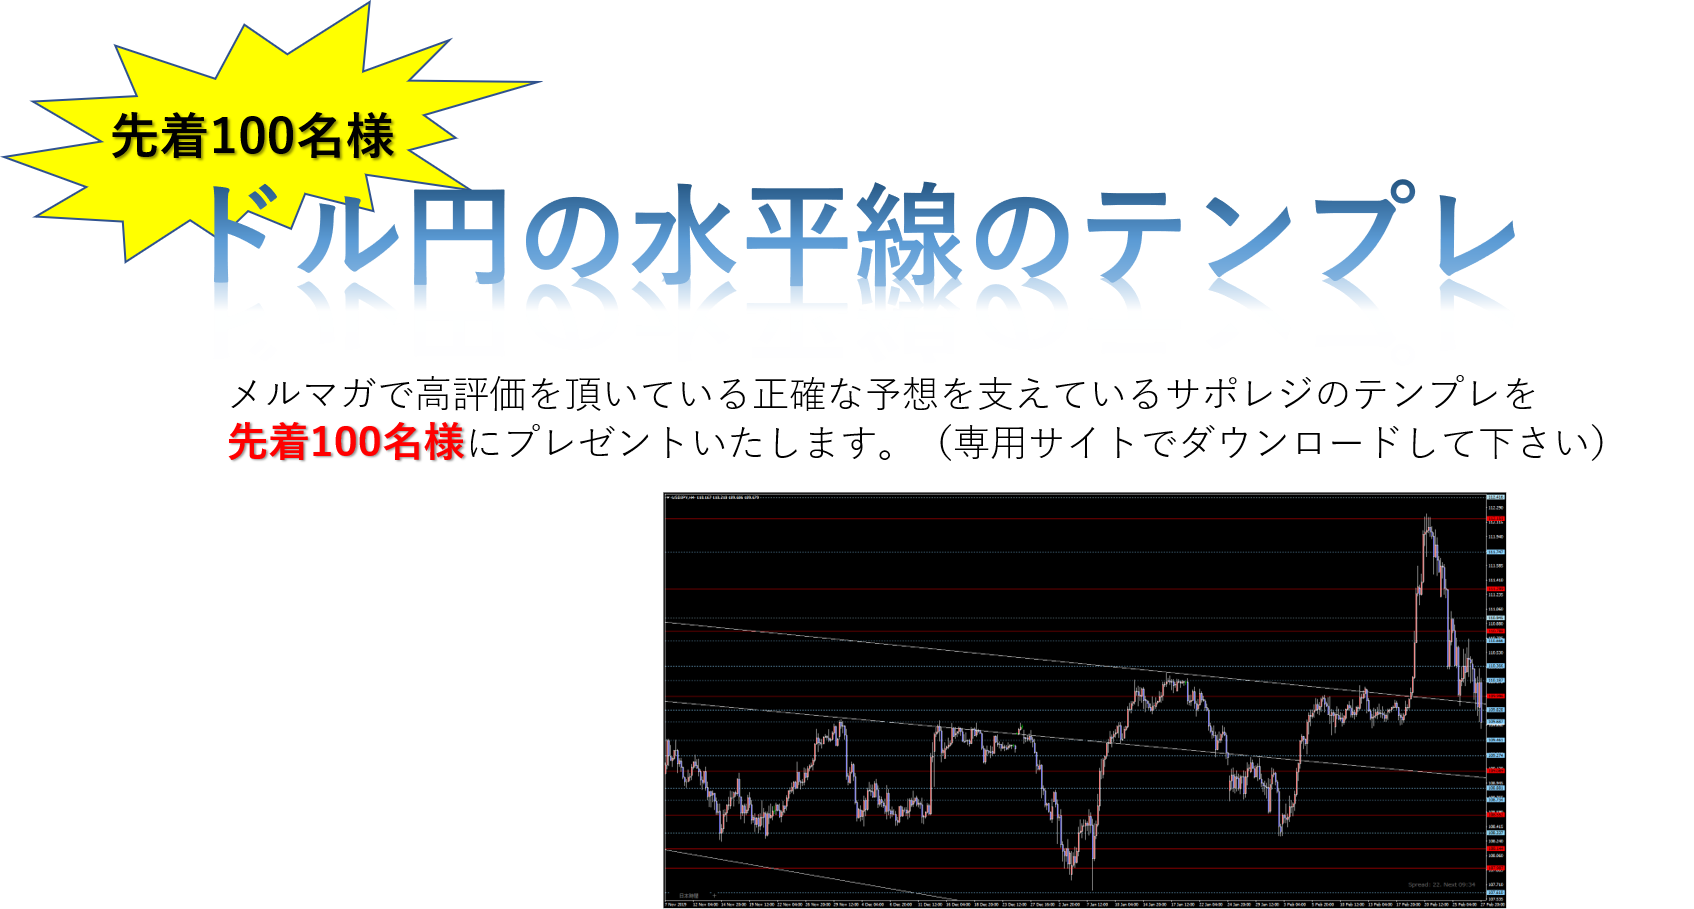
③ On a dedicated siteComprehensive support
We provide a dedicated site with MT4 downloads, how to integrate the indicator, how to use the Market Principles indicator, and free indicators to help MT4 beginners become effective traders on the same day.
|
Product delivery After payment, you can download a guide PDF, log in to the dedicated site described in the guide PDF, enter the order ID on InfopTop and the account number you will use for this product, and then download. We will perform web authentication within 24 hours. Note: Some registration emails may go to the spam folder, so please check there as well. |
|
Investment risks and fees |
|
System requirements CPU 3.0GHz or higher / memory 8GB or more / wired Internet (Wireless ok) |
Now is the time to choose whether you’ll blend into the crowd or break through the crowd. |
There are two types of traders who win in trading.
※ After purchasing this product, you will need to submit your account number.
Reason: as follows.