
【FX full-time trader cat’s pound-yen trade analysis 0325】
This is the Pound/Yen on March 25.
As always, volatility remains high.
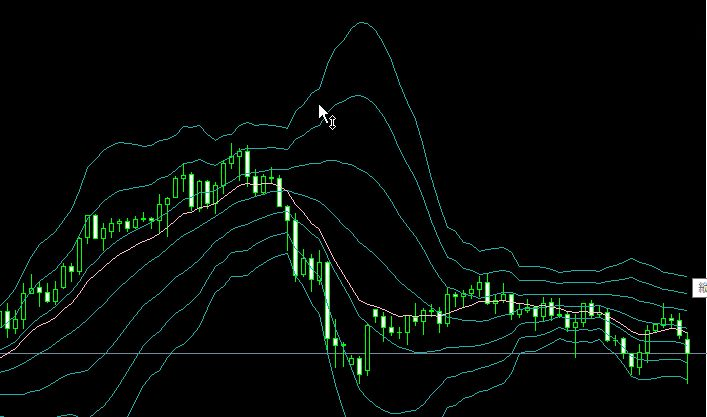
This is a 4-hour chart.
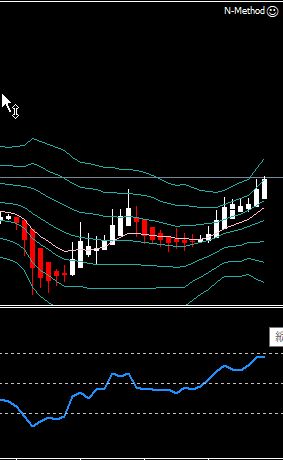
The middle band has turned upward, RSI is above the 50 line, and it has become bullish.
The bands have expanded, so there is momentum.
Band expansion has a double meaning: it indicates momentum and also overbought/oversold conditions.
If you don’t understand this, you might feel fooled by technical indicators.
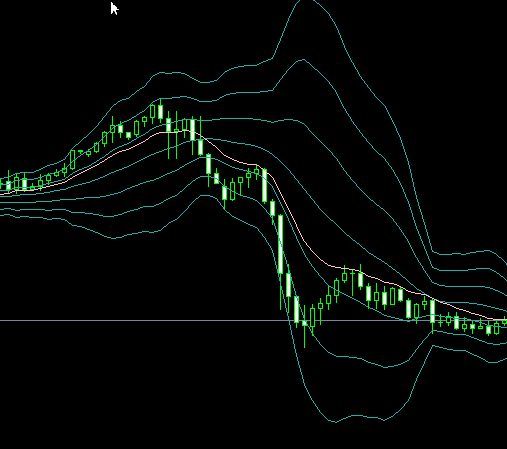
Let’s look at the daily chart.
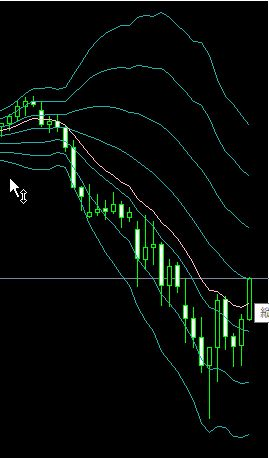
It is touching the middle band, which separates bulls from bears.
There are forces taking profits from the buy side and selling according to Granville’s law, and having crossed the middle band, the bulls and bears are in a tug-of-war.
Here too, the earlier 4-hour Bollinger Band’s double meaning comes into play.
Let’s look at the weekly chart.
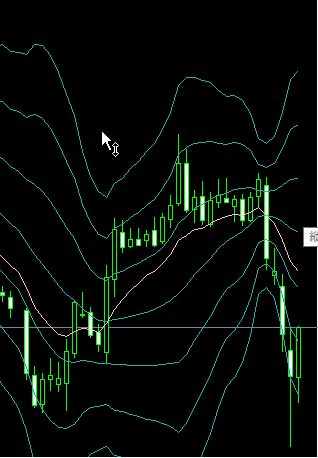
It has deviated far beyond 3 standard deviations, bounced off the monthly support, and returned to within 2 standard deviations.
There are likely forces ready to push back up and sell again here as well.
Next is the monthly chart.
It’s quite subtle, and there is a possibility of a double bottom.
Incidentally, this is what the Lehman Brothers crash looked like.
The level is a different league altogether.
So there’s no need to regret missing recent moves.
Also, 80% of markets are range-bound, so an excessive belief in trends will only tighten your own risk.
In markets, the fear of missed opportunities is the root of all evil.