
【FX Full-time Trader Cat’s Pound-Yen Trade Commentary 0322】
This time, let's take a look at the pound-yen weekly and monthly charts.
First, the weekly chart
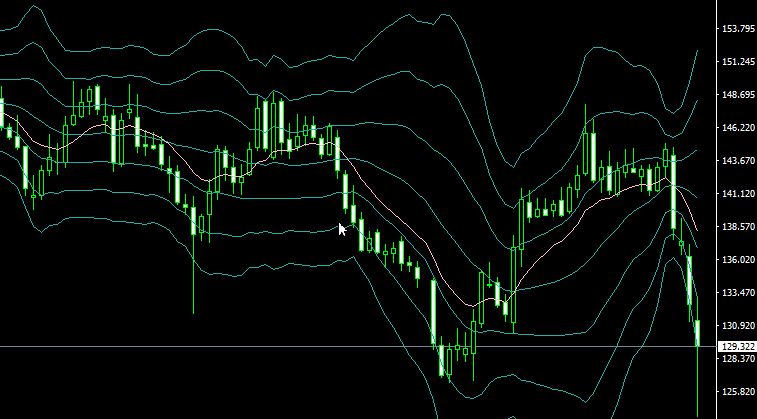
The expanded Bollinger Band at -3 sigma moved far outside and then came back in.
Next is the monthly chart.
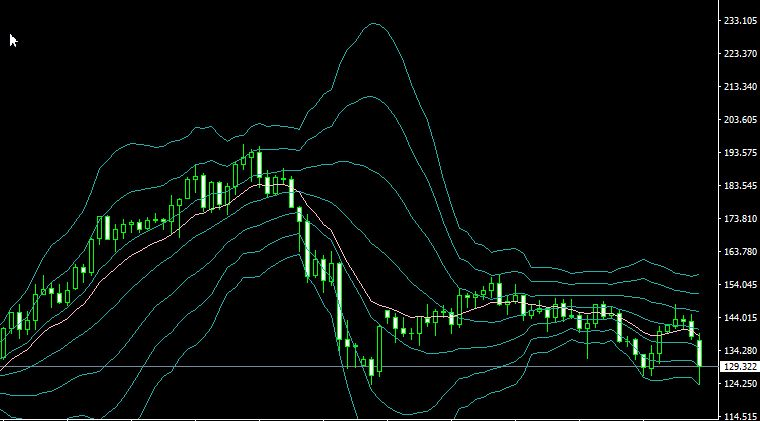
This one touched -3 sigma and rebounded.
Looking at the monthly chart alone, volatility doesn’t seem that large, but
because the weekly and daily charts are expanding, overall intraday volatility is rising sharply.
It feels like the Pound/Yen from the Lehman era, where moves of about 300 pips were common, has returned.
Back then I was a losing trader, though...
However, if we’re talking Lehman-scale, the monthly chart would be expanding and the angle of the middle band would become steep,
and we would need to walk the band. At the current state, we’re not yet at the level of 2016 when Brexit occurred.
Now, what will happen remains to be seen.
[Attack is the best defense] The N-Method that yields explosive profits is here↓↓
https://www.gogojungle.co.jp/tools/ebooks/22300