
【FX full-time trader cat's pound/yen trade analysis 0311】 About hidden divergence
A full-time FX trader cat.
This time I would like to explain about the pound-yen on March 11.
First, the 4-hour chart
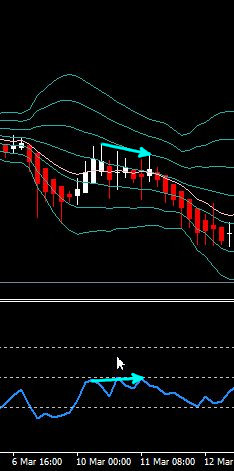
I entered here on my main job. Right after the arrow, at the next bearish candle.
What is the basis?
Hidden divergence.
RSI rising on the right while the currency value declines on the right, and it has been stopped by the 50 line twice.
And the daily chart
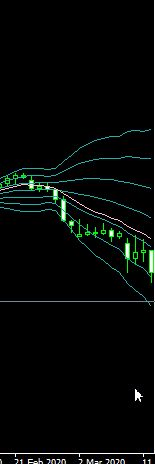
At this far-right bearish candle, this part.
The Bollinger Band is expanding and the middle band tilts significantly
And it is doing band-walking at 1 standard deviation of the band.
This is a pattern where the theory fits very neatly.
But the market can win even without using theory or rules.
Always think backwards from the purpose of taking on the market.
【For those seriously aiming to become full-time traders only】 N-Method, which has repeatedly generated 300 PIPS and 800 PIPS, is here↓↓
× ![]()