

Dow Jones and Nikkei Stock Average both formed a bottom!
The NY Dow dropped more than 2300 dollars, the largest decline on record, and the Nikkei Average also fell below 17,000, suggesting that a bottom may have formed.
It appears that the bottom has formed.
Let’s look at the charts for the NY Dow and the Nikkei 225 (CFD) respectively.
NY Dow 4-hour chart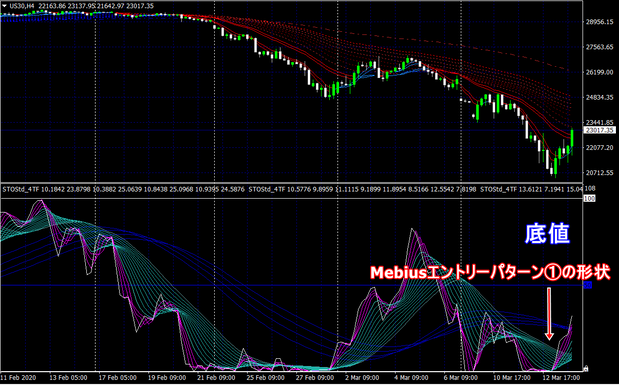
Nikkei 225 4-hour chart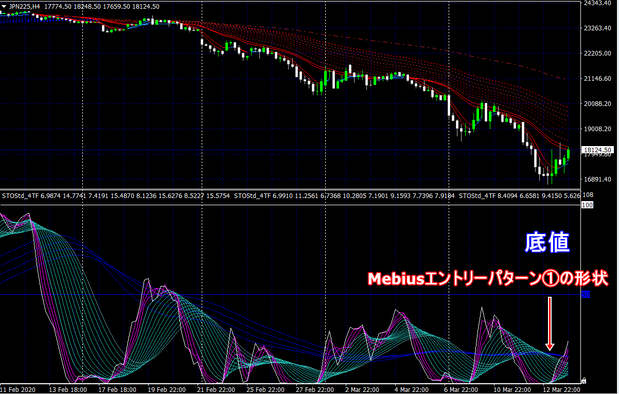
Bothform the bottom in the shape of Mebius entry pattern ①
If we also look at the same point on the 1-hour and 30-minute charts,
Nikkei 225 1-hour chart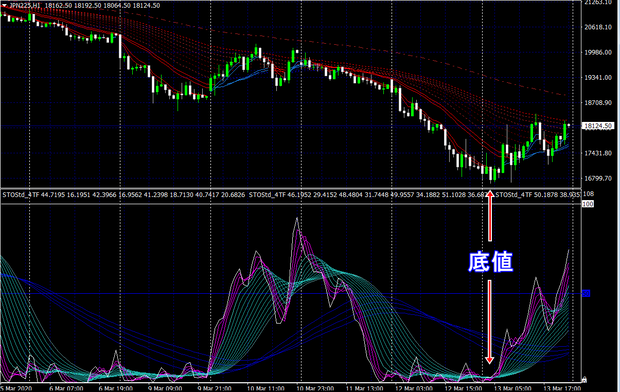
Nikkei 225 30-minute chart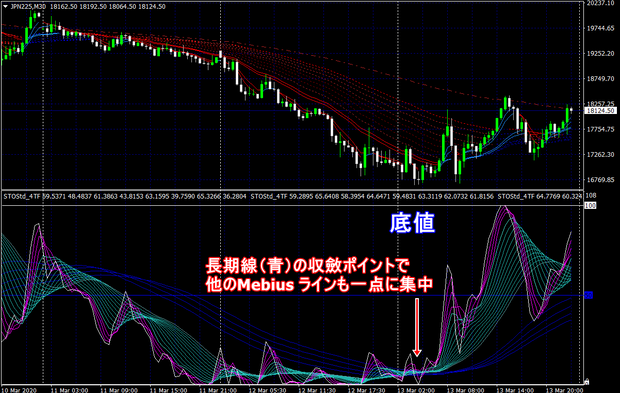
On the lower daily chart, the bottom formation is not yet confirmed, so
there is a good chance of a second bottom or third bottom in the future, buton the 4-hour chart level,
we have temporarily entered a rebound phase, so the Nikkei Average may rebound toward around 20,000.
NY Dow Daily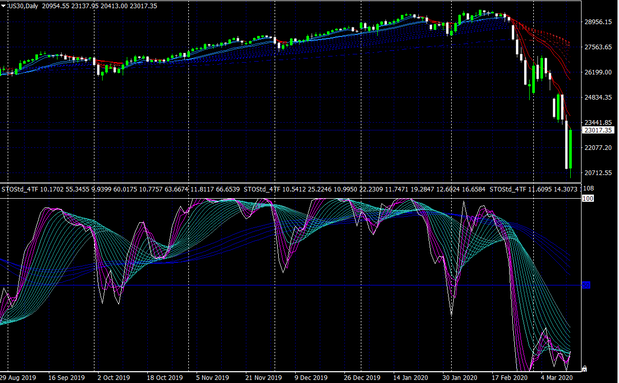
Nikkei 225 Daily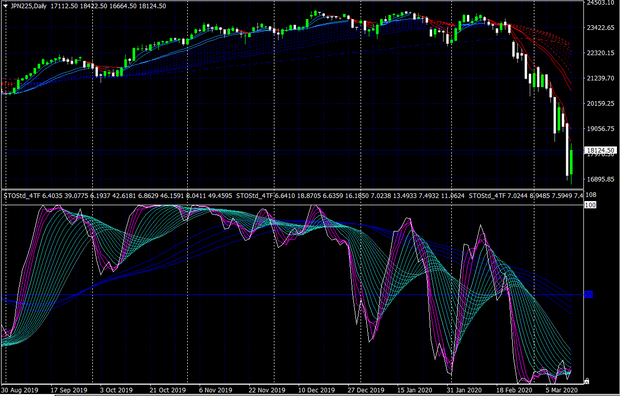
By the way, in the USD/JPY pair, from the yen depreciation to 112 yen per dollar on February 20 to the 101 yen range on March 9,
it has drawn a very clean shape of forming a top-to-bottom pattern.
USD/JPY 4-hour chart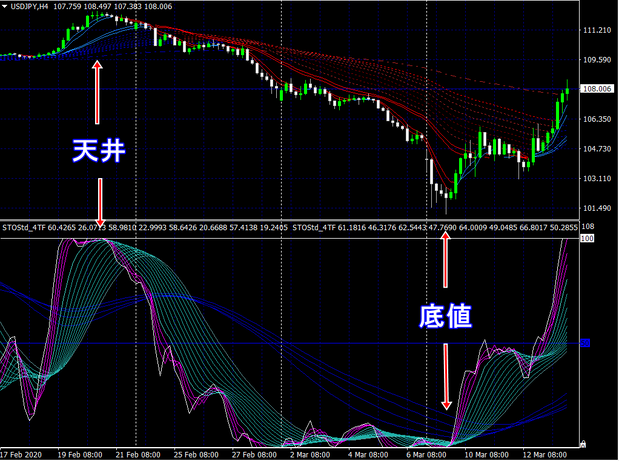
Binary Options to FX and Nikkei 225,covering all MT4 charts!!You can visually determine market turnsand identify entry points with this discretionary indicator!Mebius (Mebius)


