Principles and Indicators of the Market, 300 PIPS Hit
There is often an image of a chart you can see on FX teaching materials sales pages,
where a bottom or top signals that you could have captured the maximum, right?
But isn’t there a doubt whether that is truly the case?
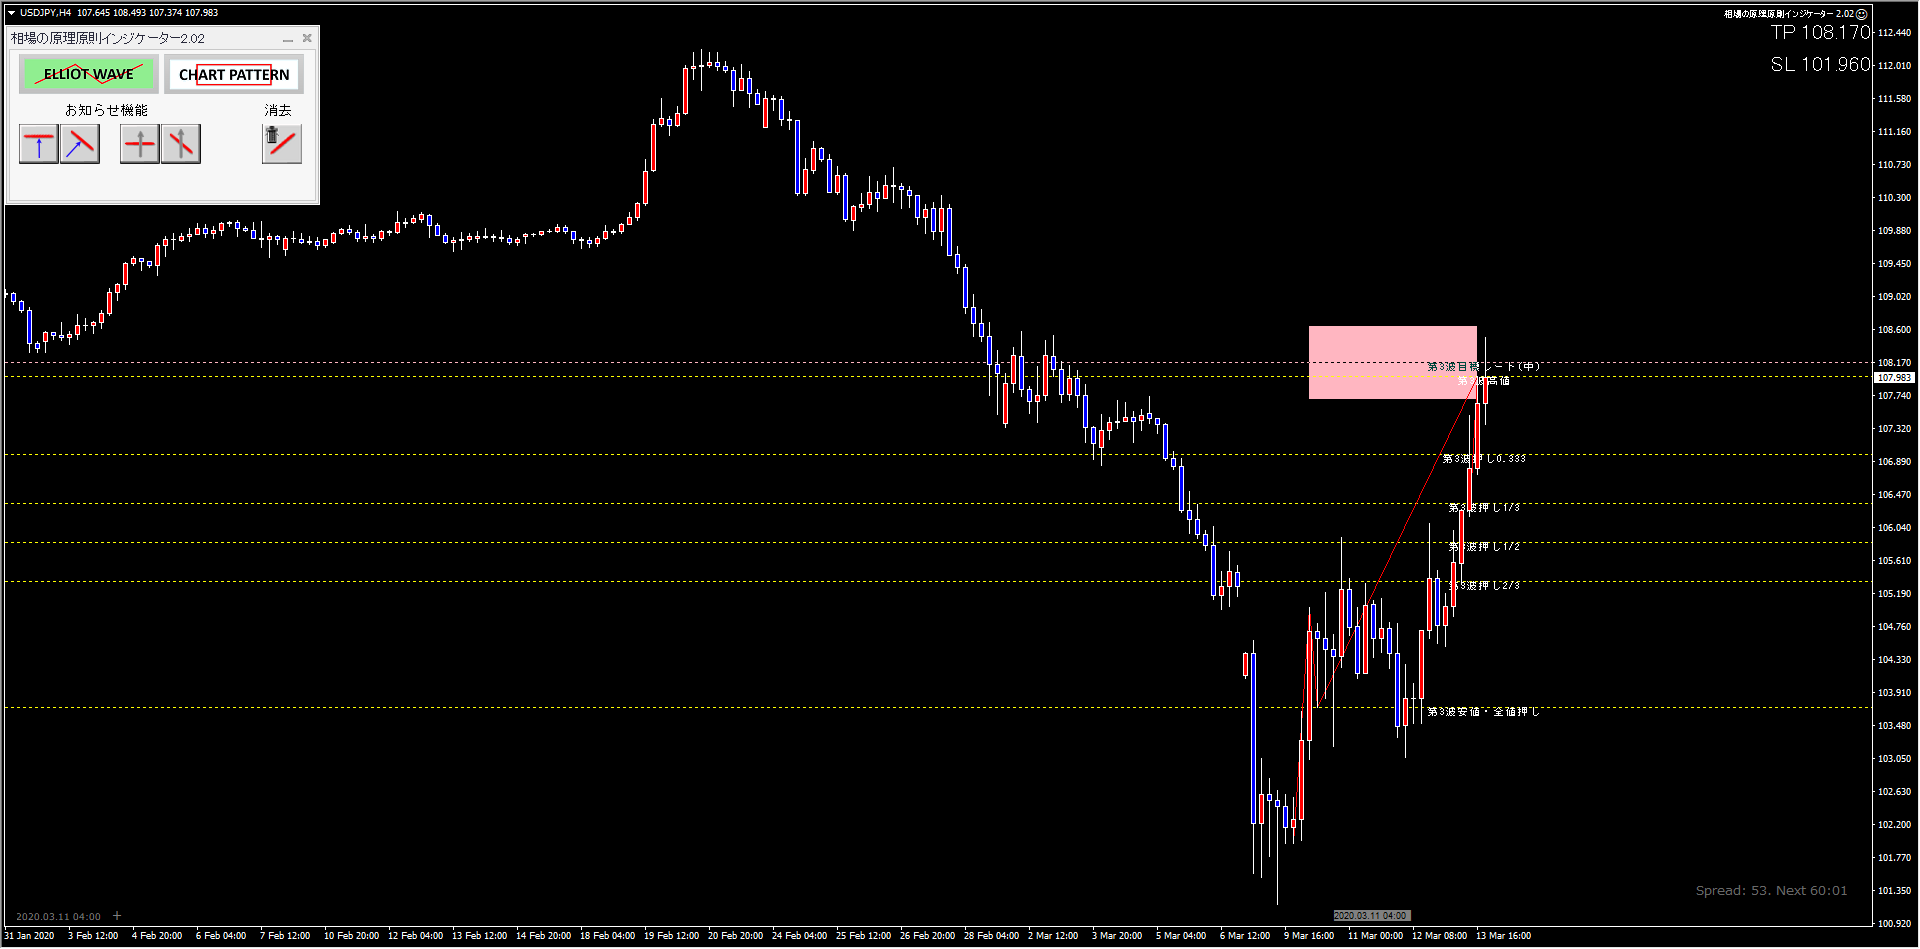
In the case of indicators based on the principles of the market,
the image below is,“The price movement scenario of USD/JPY”,
which was output in advance as an expected target value,
this forecast uses the principles of the market indicators.

If you ask what happened to this forecast the next day,
the mainstream of FX indicators until now has been
to display arrows at the timing of entry,
and arrows at the timing of exit have been the mainstream type.
But with this type, you can replace it with any chart that is convenient later on
and pick only the cases where it worked wellas well.
To put it more plainly,
since you cannot know the risk-reward in advance,
you don’t even know whether trading is worth it.
With this, will discretionary traders really be able to win?
I don’t think so highly of that possibility.
However,the Principles of the Market Indicator,
outputs the points for stop loss and take profit at the very start
so there is no room for such deception, and
you can test it on the left side of the chart as much as you want.
Did the results come out with the indicator you are using now?
Did capital grow with an EA that boasts high win rate?
For example, 99% win rate! PF 2.0!!
The catalog specs are wonderful.
Yet, people who get dazzled and dream because of this
to put it bluntly,the uninformedare so-called
First, develop a habit of thinking for yourself.
Think calmly and doubt things carefully.
A win rate of 99% and PF 2.0 focus on PF, and PF is calculated as profit ÷ loss, so
for example,
for a profit of 20,000,
a loss of 10,000 would occur.
To make things clearer, let’s set PF to an expected value of 0, i.e., PF 1.0.
If PF is 1.0,
99 wins and 1 loss would bring you to break-even.
In other words,unless a win rate of 99% or higher is guaranteed
capital will decline, sharplyover time.
over-optimized to past markets
fitted withcurve-fittingtend to be
Let’s think in terms of risk-reward.
If 50 wins and 1 loss equals 5 minutes,
the risk is 50,
the reward is 1.
In other words,
to receive a reward of 200, the risk is 10,000
to receive a reward of 2,000, the risk is 100,000
to receive a reward of 20,000, the risk is 1,000,000
A losing streak ends it all
If a losing turn comes around,
would you move the stop loss position?
Professional investors know that win rate alone is not important.
Rather, they focus all their effort on controlling risk.
Why is that?
Becausethey know it tends to leave more profits behind
.
So, in a risk-reward of 50:1 trades,
simplifying, a risk-reward of 1:0.02
extremely high-risk, low-reward trades
cannot be said to have controlled risk.
And, can curve-fit EA consistently surpass a highly challenging 98% win rate?
...
Will it?
You should start to realize that,
recognize risk-reward in advance, and
accumulate win-rate data in a trading journal using the
current conditions,
and choose to win with proper trading?
Definitely with the Principles of the Market Indicator, you can do that
It is possible with
FX, CFD, and Bitcoin
all-in-one support
For details about the Principles of the Market Indicatorclick here