

Viewing this global crash in real-time with “Mebius”
This week's New York stock market Global spread of the novel coronavirus shows no sign of stopping the worldwide spread,
and it has fallen for seven consecutive trading days. It is a global financial crisis market not seen since the Lehman Brothers collapse.
Let us see how the Mebius indicator is interpreting this abrupt drop.
First, the weekly charts of the Dow Jones and the Nikkei 225.
Dow Jones weekly(Image enlarges when clicked)
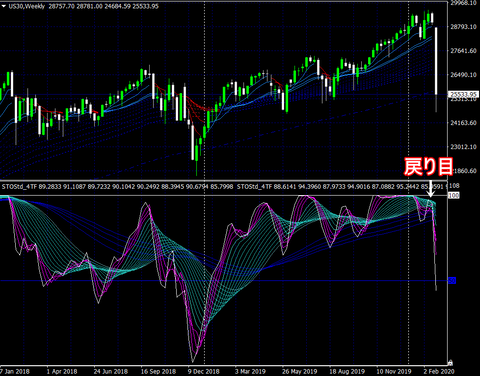
A bearish candle last week indicates that the previous week’s peak was the rebound peak.
Nikkei 225 weekly
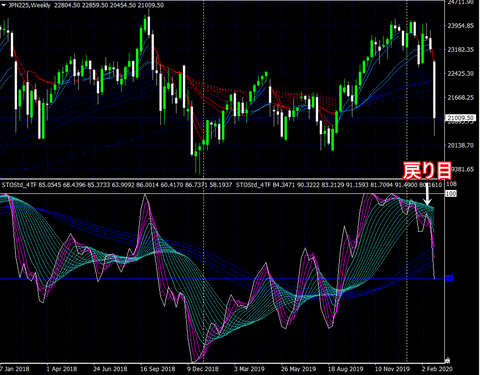
It is not common to look at weekly charts, but the Nikkei 225 is similar,
and the rebound has been confirmed by last week’s bearish candle, so at the end of last week,
there is a high likelihood that this week will also display bearish candles (for whatever reason the decline occurs)
and the Mebius curve has taken that shape.
On the daily level, how does it look?
Dow Jones daily
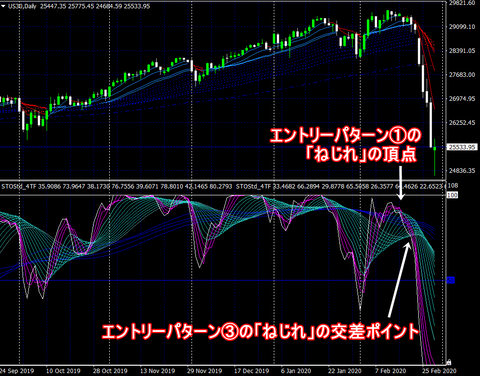
In Mebius, based on the curve shape, there are five basic entry patterns
that are referenced (※Reference) there are five,
and as of February 17, the first is the peak of the vertex of the Entry Pattern ① "twist"
indicating the top of the rebound.
Then, as of February 20, the intersection of the "twist" of Entry Pattern ③ shows
a break below (bottom break) state, which explains the plunge from the start of the week (Feb 24).
Nikkei 225 daily
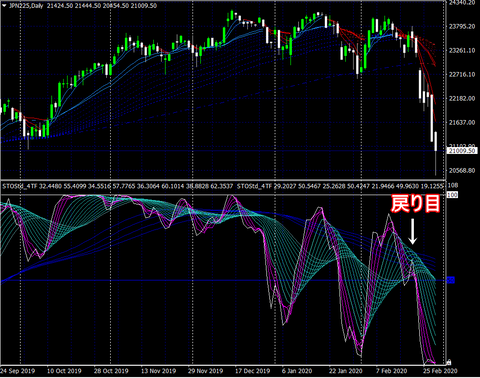
The Nikkei average also largely follows suit, and with last week’s bearish candle,
the rebound after the twist of Entry Pattern ④ is confirmed, forming a bottom-break pattern by the end of last week,
implying a steep drop after the 24th.
Furthermore, on the 4-hour chart, a more precise entry point becomes visible.
Dow Jones 4-hour
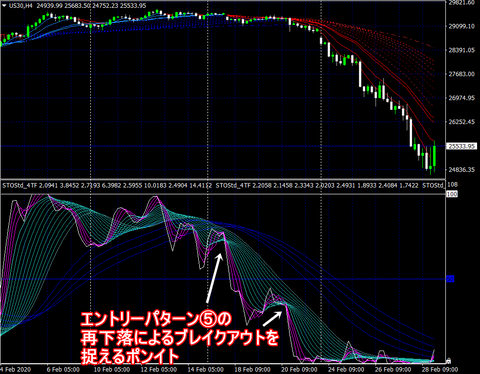
On the Dow Jones 4-hour chart, there were two entry opportunities as of last week’s point,
as can be seen.
The first was at 17:00 on the 17th (MT4 time), when a bearish candle appeared,
the second at 13:00 on the 20th (MT4 time), both representing Entry Pattern ⑤
points to capture a breakdown from a renewed decline as the candle closes, indicating a bottom breakout.
Nikkei 225 4-hour
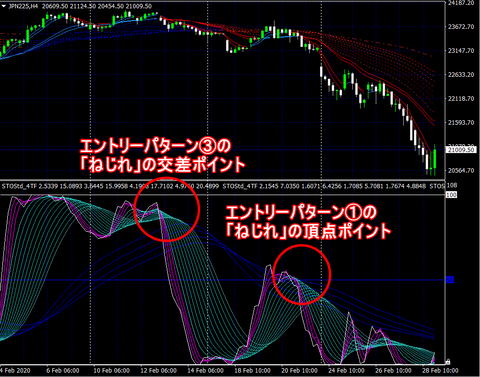
In the Nikkei 225 as well, there were two major “sell” entry opportunities
as of the week before last and last week.
First, at the 13th, the twist of Entry Pattern ③ intersection point showed
and the second at the 20th, the vertex of Entry Pattern m① twist.
In particular, the 20th point directly led into this week’s plunge.
Now, how about the currency side?
Let us review the USD/JPY situation.
USDJPY weekly
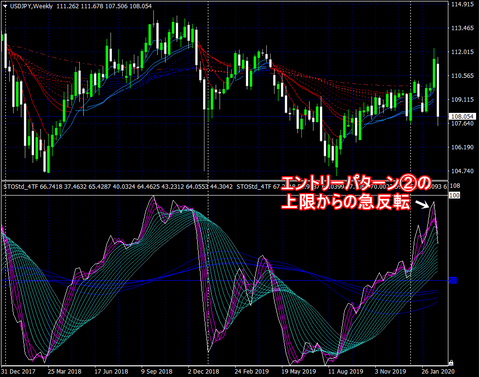
After a sudden yen depreciation to 112 per dollar last week, this week from the start
the entry pattern ② formed a sharp reversal.
USDJPY daily
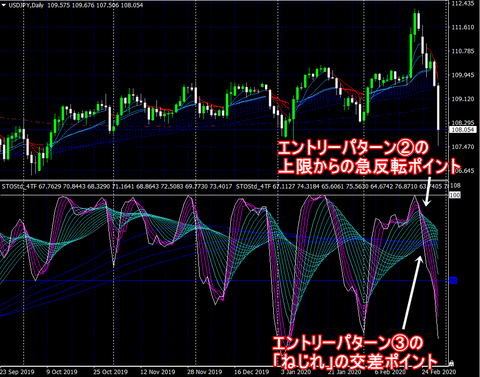
From the week ending on the 20th to the start of the 24th, a sharp reversal from the upper bound of Entry Pattern ②
occurred, forming a typical sharp “spiky peak” shape. It then became a bottom-break shape on the 27th.
On the 4-hour chart, entry points become clearer.
USDJPY 4-hour
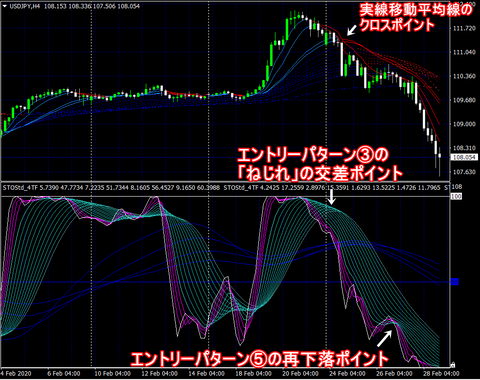
First, from 08:00 to 12:00 on the 24th (MT4 time),
the intersection point of Entry Pattern ③ "twist", or
when viewed with moving averages, two moving average lines crossing.
Furthermore, from 20:00 on the 27th to 00:00 on the 28th (MT4 time),
the point to capture a breakout from the renewed decline of Entry Pattern ⑤
appears.
Finally,
the market ahead is unpredictable to anyone, but
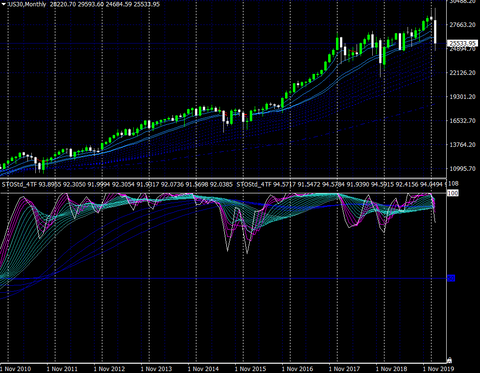
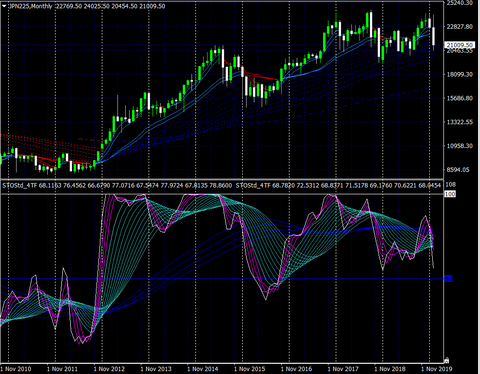
excluding short-term rebounds, when viewed on a monthly chart for both the Dow Jones and the Nikkei 225,
the shape of Mebius still has room to go lower,
so this year, a heightened sense of caution toward the downside is warranted.
Dow Jones monthly
Nikkei 225 monthly
gogojan product page: https://www.gogojungle.co.jp/tools/indicators/22617

× ![]()


