

The FTN indicator system that lets you survey the chart at a glance and instantly know which phase you are in
Indicators are a 'yardstick'.
For example,
“to determine where the current price sits within the range formed by the highest high and the lowest low over a fixed past period.”
“to calculate”
“to draw a line representing the moving average, and lines indicating the range of price movement above and below it.”
etc., it’s simply about automating tasks that would be tedious for humans to compute one by one.
We believe that the people who use that 'yardstick' indicator are important.
Recognize the chart's direction correctly and use the 'yardstick' properly.
That is the FTNS concept.
【Advanced Section ①】
1 Short-term contrarian
2 Adjustment (reversal) short-term contrarian
3 Range contrarian
4 Range-trend following
【Advanced Section ②】
5 Following the trend, pyramiding
6 Multi-timeframe
7 Monitoring multiple currencies
8 Risk management
9 Position management
10 Where to place the stop loss
Looking at the market from a higher view, properly deciding entry grounds and setting stop-loss rules,
It is a very straightforward thing, but with carefully selected indicators and a logical manual,
you will be able to understand which phase you are about to trade now.
■Set Contents
・Strategy Manual (Basics) ×1
・Strategy Manual (Advanced 1) ×1
・Strategy Manual (Advanced 2) ×1
・MT4 Indicator Set (ADX-based, Supply and Demand (resistance bands), Heikin-Ashi enhanced version
— capturing prominent volume, displaying the currency pair name on the chart, automatic pivot
chart overlay)
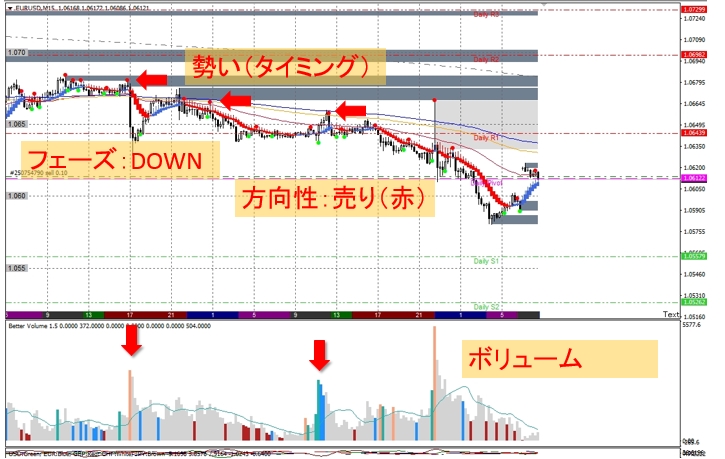
If you run the chart at double speed, you’ll clearly see where the buy/sell points are!
============================================================
FX-On overall review (personal opinion of the author):
Using volume as the basis for entries was something I found very insightful.
There is also an indicator for resistance bands (the gray bands),
and since resistance bands are drawn automatically, they can serve as a guide for pullbacks in uptrends and retracements in downtrends,
and it’s convenient to know when price is sandwiched between the bands, indicating a range.
Moreover, displaying higher-timeframe charts helps you see larger resistance bands, aiding a fixed viewpoint.
Using the currency strength indicator in the Advanced Section helps identify currency pairs with higher volatility,
so you won’t have days where you can’t trade in a range.
All indicators are explained in detail, and the basis for trading was very easy to grasp.
============================================================
The sales page is here
You can view the verification video here ♪
↓↓↓


