

Mebius (Mebius) Entry Method (Part 5)
Among five entry methods of Mebius indicators, today we introduce Entry Pattern ⑤.
【Features of Mebius】
As the name suggests, the Mebius indicator “Möbius strip” resembles a band of lines that
repeats its “twists”.
The point of these “twists” signifies market reversals.
Utilizing this property, visually assessing reversals
=entry points based on the shape of the band, through discretionary judgment.
【Screen Layout】
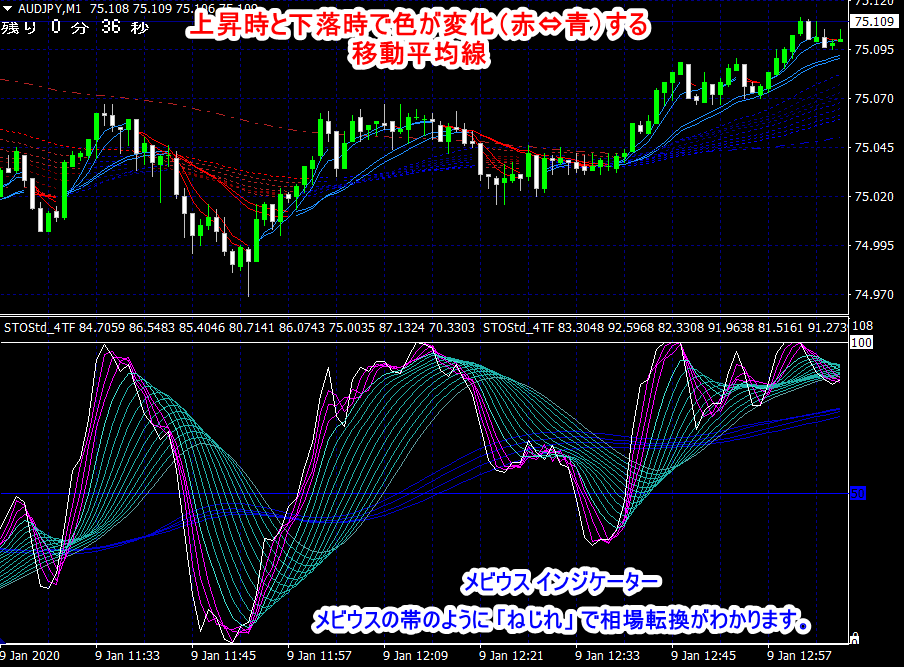
Top window: Moving average lines with candlestick chart
・Each moving average line changes color when the price rises or falls.
When rising blue, when falling red.
・Two moving averages that are crucial for judging reversals (two up, two down) are solid lines,
the others are shown as dotted lines for reference.
Note: The crosspoints of the two solid moving averages (two up and two down)
are high-probability reversal points.
※ In prolonged uptrends, the blue lines below the solid lines act assupport levels
and in downtrends, the red lines above the solid lines act asresistance
・Top-left corner shows the remaining seconds until the current candlestick closes “remaining seconds”.
Bottom window: Mebius indicator
Short-term line: white and pink
Mid-term line: green
Long-term line: blue
・If the green band is above the blue long-term line, the market is in an uptrend,
If the green band is below the blue long-term line, the market is in a downtrend.
【Entry Methods】
Trading method: ・Binary options High/Low 3-minute trades
・For other instruments such as FX, Nikkei 225, etc.,
scalping to swing trading all supported!
Currency pairs: All pairs
(*For compatibility with Mebius in binary options, the recommended pair is AUDJPY)
Chart timeframes:
・Binary options: 1-minute chart (5-minute as supplementary)
・For FX, Nikkei 225, etc., use all timeframes!
■Five basic entry patterns
Pattern ①: Entry at the vertex or bottom of the Mebius curved band
Pattern ②: Entry at sharp reversal from the upper or lower bound
Pattern ③: Entry at the twist crossing point
Pattern ④: Entry on pullback after the twist
Pattern ⑤: Entry catching breakout on re-ascend or re-descend

Pattern⑤:
Entry catching breakout on re-ascend or re-descend
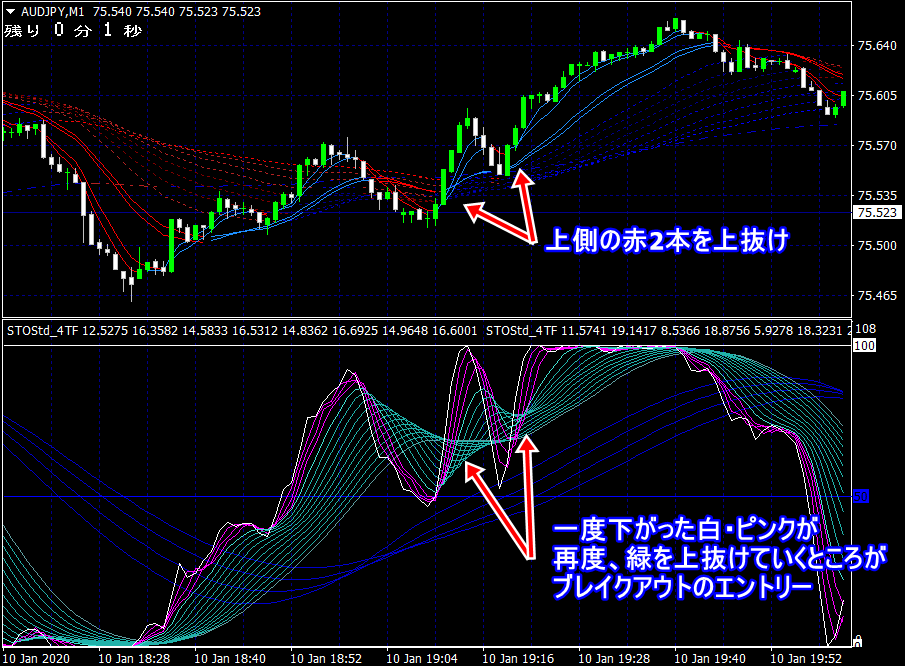
When the green Mebius band is above the four blue lines in a rising market,
the white and pink lines drop to the green outer line and reverse,
and if they break above the most recent high, it is likely a breakout.
This is where the entry point is, when the white and pink lines break above the green.
At the same time, the entry point is where the upper red two moving averages break above.
In a downtrend,
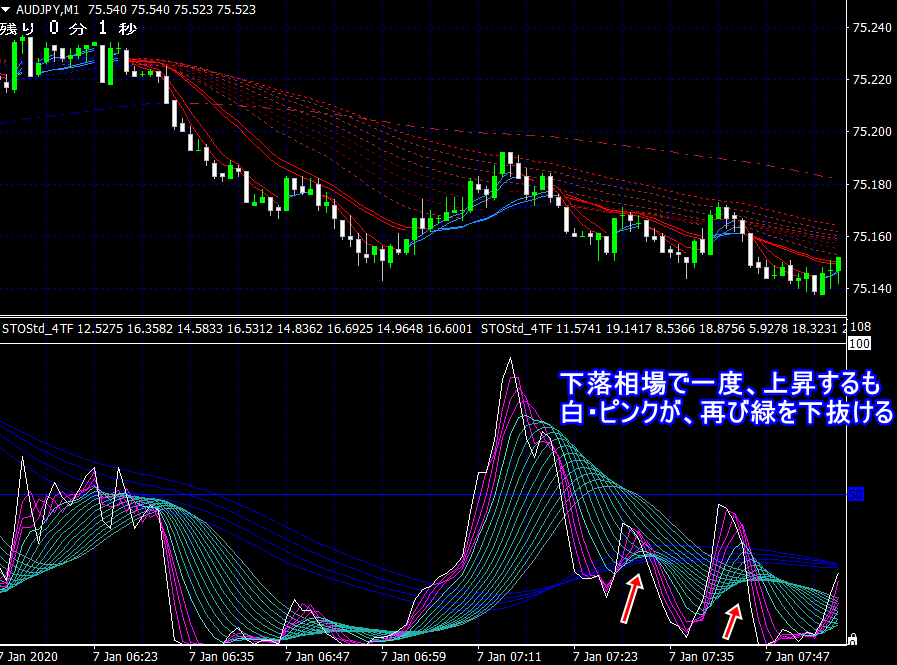
If the white and pink, after rising, again drop below the green, it is likely a downside breakout.
The entry point is where the white and pink lines break below the green.


