

What is price action?
As the words themselves say, it is about the “movement of prices,” right? The shape of candlesticks is also a kind of price action.
Any time the market is moving, all price movements that occur are price action.
However, there are important price actions and unimportant price actions.
These are not movements called candlestick formations like harami, doji around/near the close, or engulfing patterns.
Those happen anywhere. What’s important is that the place where such reversal shapes occur can be predicted from past price action.
So what is past price action? For example, suppose there is a past support/resistance line as in Figure 1.
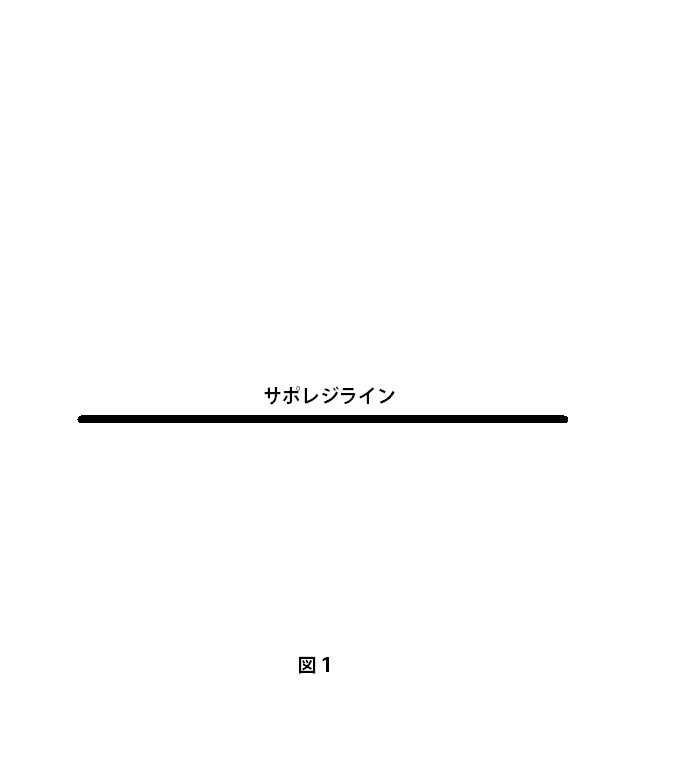
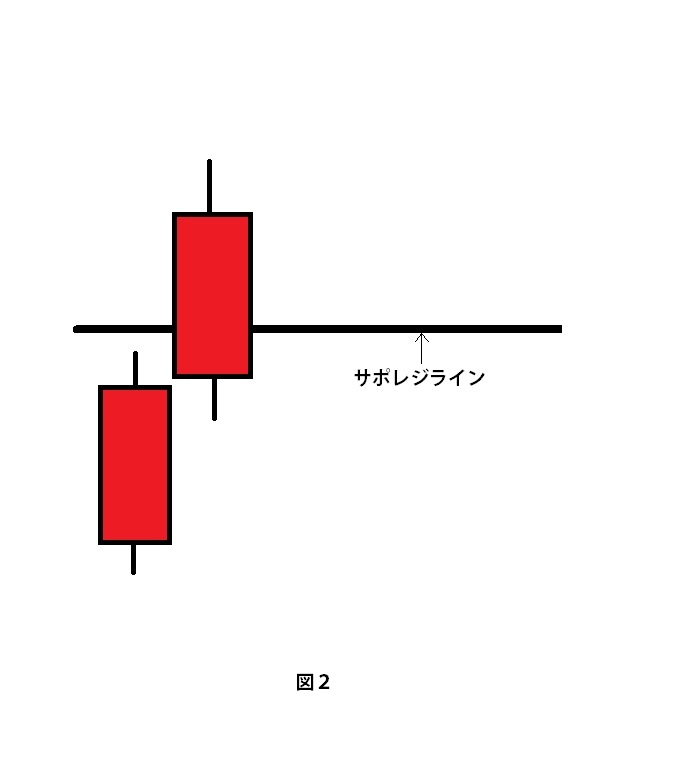
Candlesticks approach that line with bullish candles, and before touching the line, the candlestick briefly changes direction in front of it.
After ending with a slight upper wick, the next candle forms a small lower wick and breaks above the support/resistance line, closing the second candlestick.
The price action that occurred just before the initial support/resistance line becomes the new support/resistance zone.
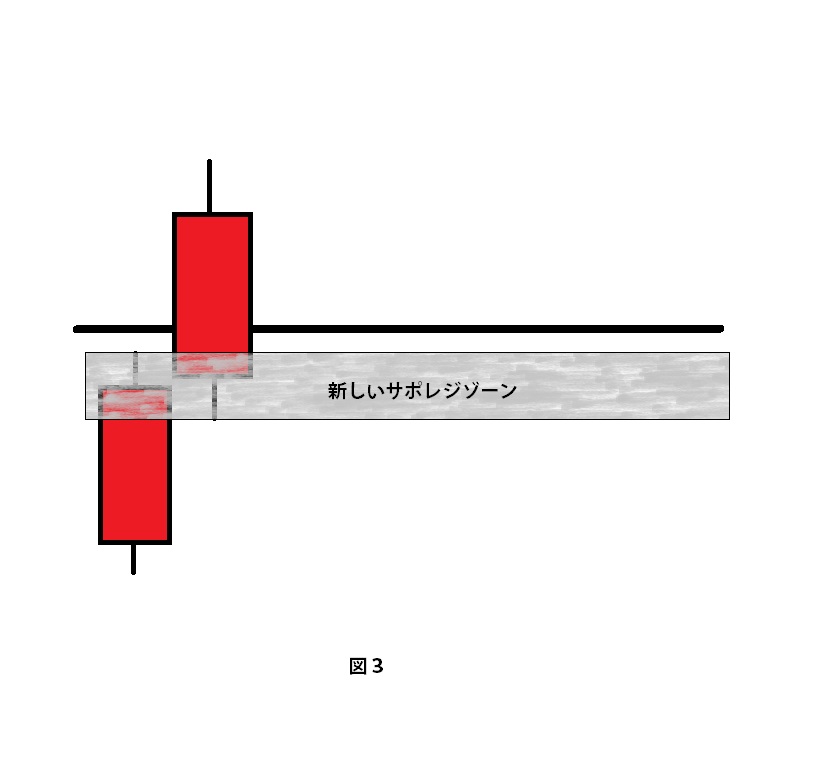
Thereafter, we can expect price action indicating a reversal at the new support/resistance zone.
Why is that? Because the original figure 1 had a support/resistance line. In other words, this line is a resistance that caps the upside.
Before that resistance line, due to pressure trying to push prices downward, the candlestick is pushed back and ends there.
That is the first bullish candle. The second bullish candle breaks upward, but before breaking, it initially moves downward.
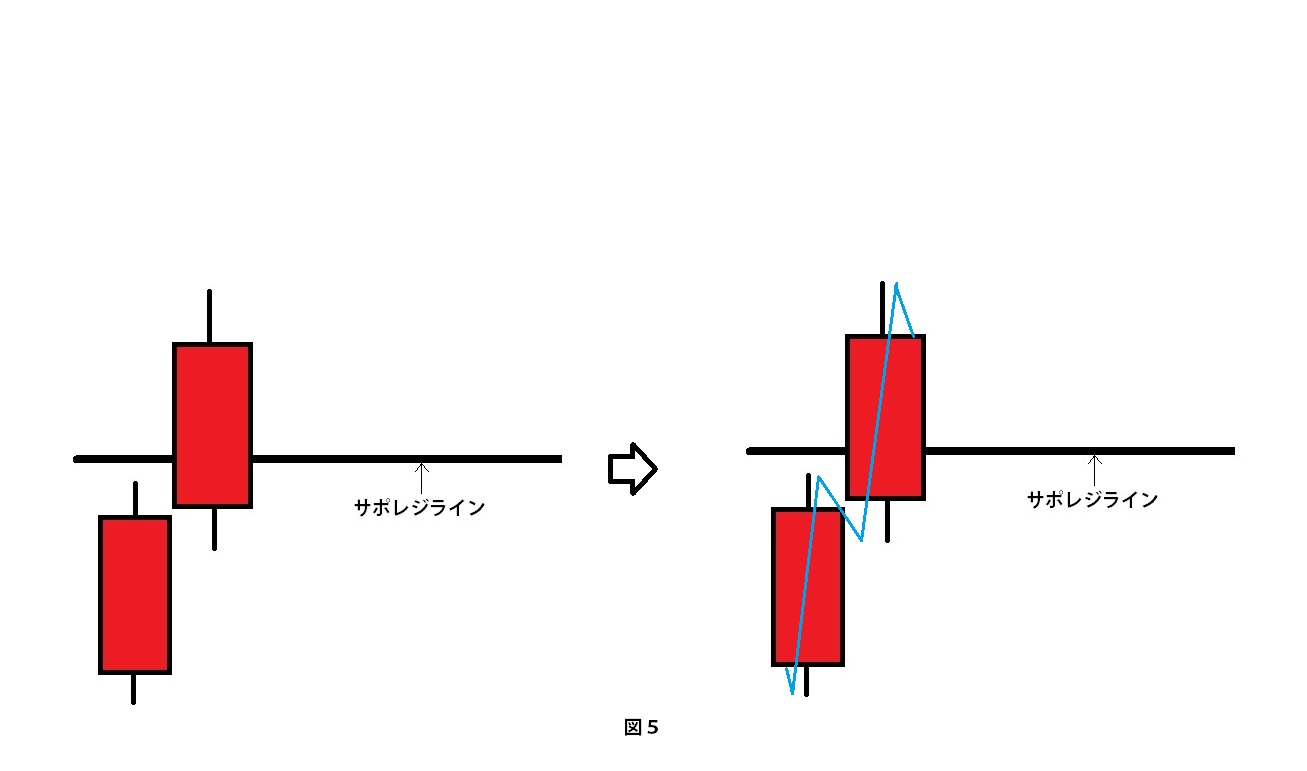
The blue wave drawn in Figure 5 represents the two candlesticks’ movement. After being resisted by such a support/resistance line and pushed back, it eventually breaks higher, and the consolidation becomes the new support/resistance.
About candlestick shapes
Many books introduce candlestick patterns, but the truly important candlestick shapes appear when combined with support and resistance.
From the price action near the initial support/resistance, you can judge where the next new support will form.
This figure is just one example, and there are still many other candlestick shapes that form support/resistance.
If you keep an eye on past price action near support/resistance, I think you will start to see the next support line (zone).
Humans can only see what they want to see, so you won’t notice unless you intend to look.
At first, it’s okay to be wrong, so please learn to observe carefully and make your own judgments!