

Möbius (Mebius) Entry Method (Part 2)
From the five entry methods of Mebius indicators, today we introduce Entry Pattern ②.
【Features of Mebius】
As its name suggests, Mebius indicators resemble “the Möbius strip”,
where the band of lines repeatedly twists.
The point of these “twists” signifies market reversals.
Using this characteristic, visually from the shape of the line bands,
we judge market reversals = entry points by discretionary judgment.
【Screen Overview】
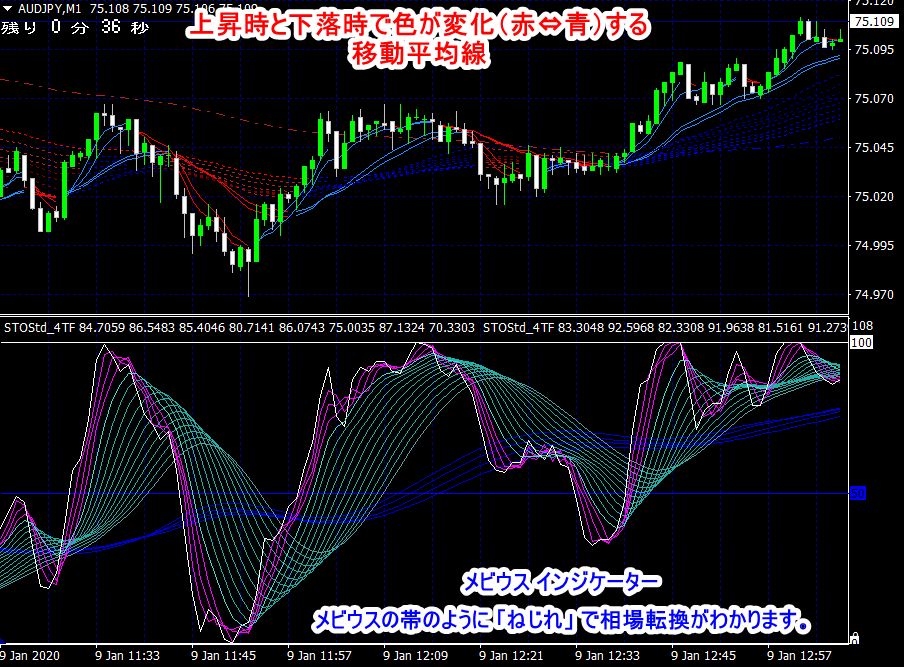
Top window: Candlestick chart with moving averages
・Each moving average changes color on uptrends and downtrends.
Upward: BlueRed
・Two important moving averages for judging reversals are solid lines, the others are shown as dashed lines as indicators.
The cross points of the two upper and two lower solid moving averages
tend to be high-probability reversal points.
・In a long uptrend, the blue lines below the solid lines act assupport levels.
In a downtrend, the red lines above the solid lines act asresistance levels.
・Displayed at the top-left corner: the current candlestick counting down to close “time remaining”
Bottom window: Mebius indicator
Short-term line: White and pink
Mid-term line: Green
Long-term line: Blue
・If the green band is above the blue long-term line, it indicates an uptrend,
If the green band is below the blue long-term line, it indicates a downtrend.
【Entry Methods】
Trading method: ・Binary options High/Low 3-minute trades
・For other instruments such as FX, Nikkei 225, etc.,
scalping to swing trading all supported!
Currency pairs: All pairs
(Note: When considering compatibility with Mebius in binary options, AUDJPY is recommended)
Chart time frame:
・Binary options: 1-minute chart (5-minute chart used as supplementary)
・For other FX, Nikkei 225, etc., all time frames are supported!
■Five basic entry patterns
Pattern ①:Mebius curve band twist apex/bottom entry
Pattern ②: Entry from sharp reversal from the upper/lower region
Pattern ③: Entry at the twist intersection point
Pattern ④: Entry on pullback after the twist
Pattern ⑤: Entry capturing breakouts on renewed up or down trends

Pattern ②: Entry from sharp reversal from the upper/lower region
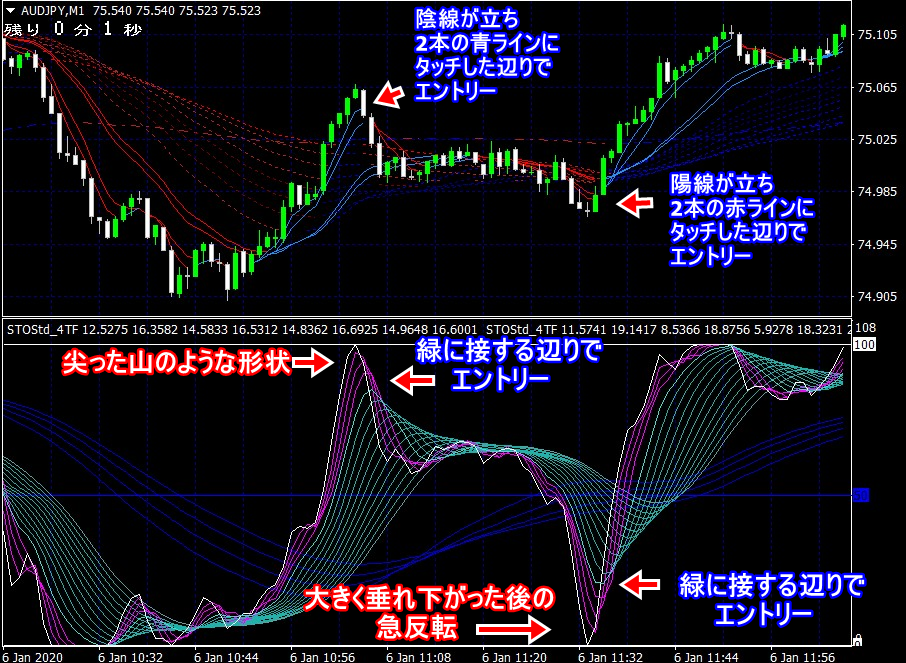
In the upper region, the white and pink lines extend upward to form a sharp, pointed mountain shape.
Then it sharply bends downward, with the area near touching green as the entry point.
At the same time, when looking at the candlesticks, a relatively long bearish candle1 bar tall (2 bars possible),
and2 bars of the blue moving average line touch, this area is the entry point.
In the lower region, the white and pink lines drop sharply, then bend upward sharply to touch green,
and that vicinity is the entry point.
Simultaneously, observe the candlesticks; a relatively long bullish candle1 bar tall (2 bars possible),
and the candle touches the red moving average line of 2 bars, which becomes the entry point.


