
Shiro Shouko's Ascendantism ~ Nikkei Stock Average and Double Inverse ~
Good evening.
Sparkling Chartist Akiko Jō Akiko is here
Today, from the open at the opening, it opened from the window downstairs,
in the end it was all-down across the board
And, regarding coronavirus-related stocks
nearly all hit the daily limit up and did not open
or, opened for entries and closed with profits
It turned into a trade only in infectious disease-related stocks
While our monitored stocks were pulling back,
on such a day
there is no need to force buying
“buying the dip on a reverse-trend”
or,
“buying in an uptrend from a bullish candlestick”
Which of my trades is it?
Nikkei Stock Average Daily Chart
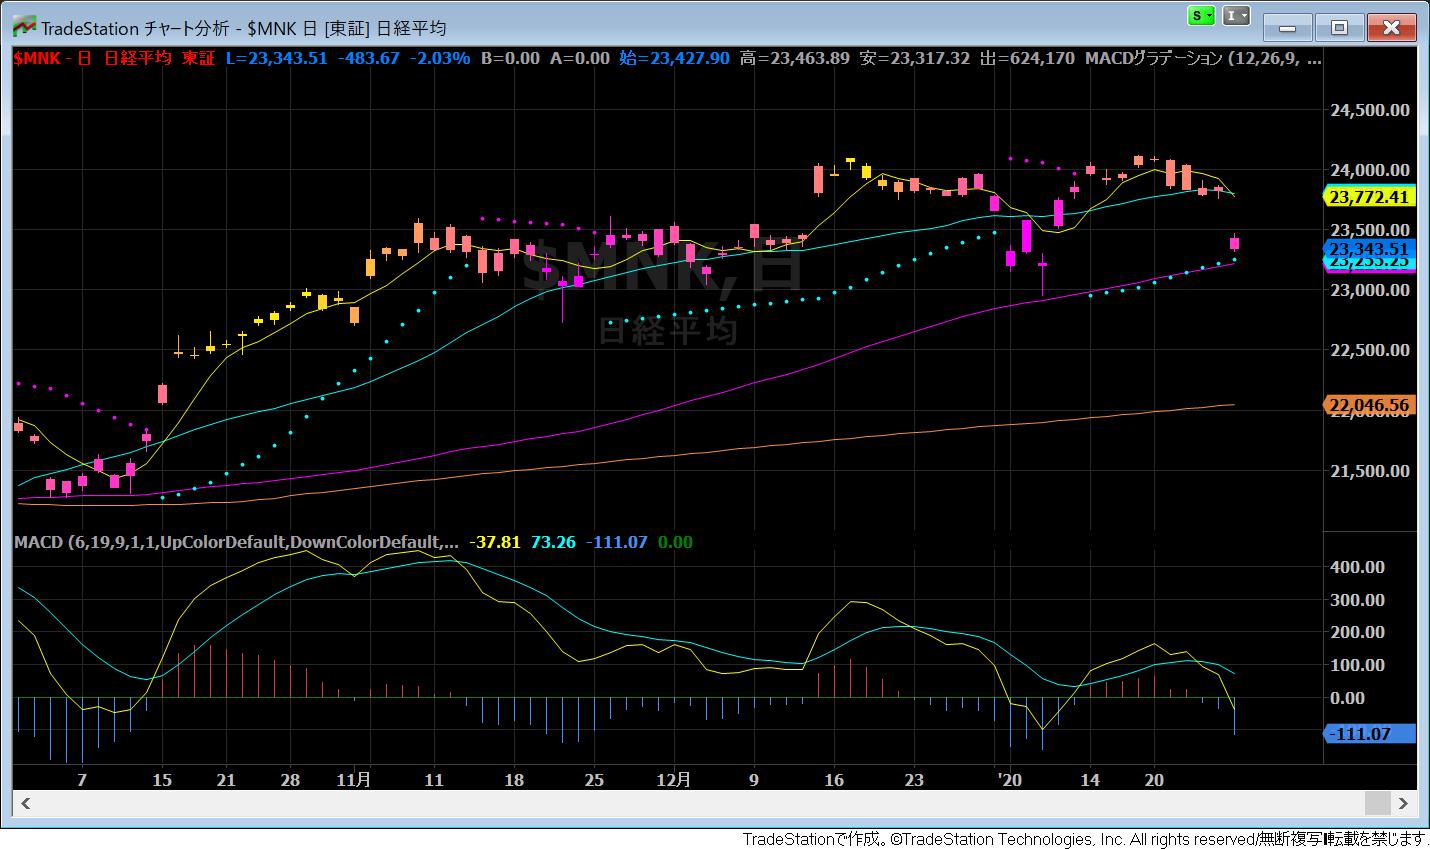
When looking at it on the Sparkling Chart,
the gradient today has turned pink.
The gradient
changes from pink to orange,
usually yellow comes next, but
this time pink → orange → pink again
has occurred.
In this case, judging by the gradient, it is considered “weak.”
Even if it rises from here and the next yellow comes,
it often does not last long
Conversely,
1357 Double Inverse Daily Chart
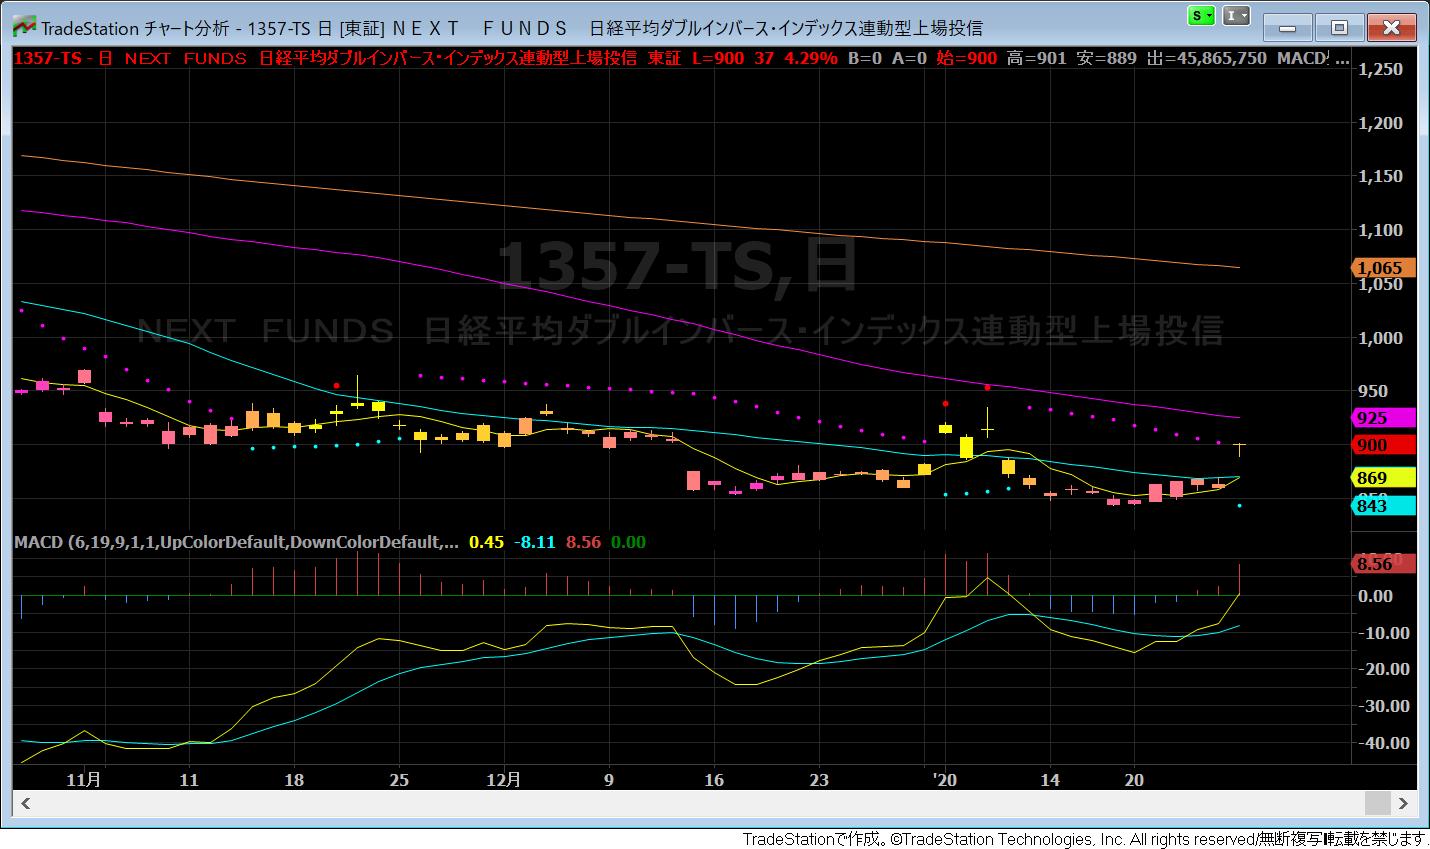
This is the opposite pattern
yellow appears, orange appears,
normally pink should appear, but
it has turned yellow again
Looking at this 1357 chart,
the Parabolic SAR has improved,
and it is finally attempting a second breakthrough of the 75-day line
It is desirable to break above here,
but the MACD is still below the zero line,
when it starts to approach the zero line, the stock price tends to move sideways briefly,
then swing either up or down
that is one way to view it
With this Treeste Sparkling Chart
the Nikkei average and the Double Inverse
both to confirm,
and then proceed toward trading individual stocks