

Mr. Tetsuo Inoue's Salon - January 16, 2020 article: Market analysis using RSI
Mr. Tetsuo Inoue's e-newsletter provides excellent market analysis. This time we have selected from recently distributed issues and turned them into an article. Reading this will be helpful for your investment activities, so please make use of it.
(The following is the full text from the newsletter distributed on December 11, "Trend 960 RSI (and Foreign Investor Trends 1)")
Tensions with Iran have temporarily (though perhaps) eased, and the VIX (fear gauge) has been hovering in the very low 12s for five consecutive days, while the Dow has finally surged into the 29,000s. As I have written many times, when U.S. market indices find a round-number level and it comes within reach, there is a tendency to feel that they must reach that level to feel settled. For that reason, there is no surprise at reaching 29,000, but the Great Rotation (large fund flows from bonds and other assets into stocks) that I have been reporting toward year-end started at that time and continues; I noted that it would appear even at this time of year-end, and it seems to continue.
However, this movement can be said to follow the same pattern as the Goldilocks market of 2017, proceeding into late January 2018, and then collapsing together with President Trump’s announcements on U.S.-China trade policy.
Whether this path will be followed, of course, depends on the above Iran (plus Iraq) situation, the progress of the second round of talks between China and the United States (breakup?), and whether this week’s start of the U.S. quarterly earnings season can justify a U.S. market P/E of 20x at the same level as late 2017 to early 2018. For now, I will quietly explain RSI levels and foreign investors' movements in Japanese stocks (due to year-end and New Year holidays and the holiday on Monday this week, data have only been released up to last year’s 12/30). Also, as noted last week, tomorrow's edition will be only the 'Trend'.)
First, the 'MVP'—the RSI total (RSI 14-day value's 5-day average plus the 10-day average). As noted yesterday, the Nikkei Average RSI (Graph 1) is in a very mid-range position and is attempting to bottom. If things move quickly, by today's close it may have bottomed.
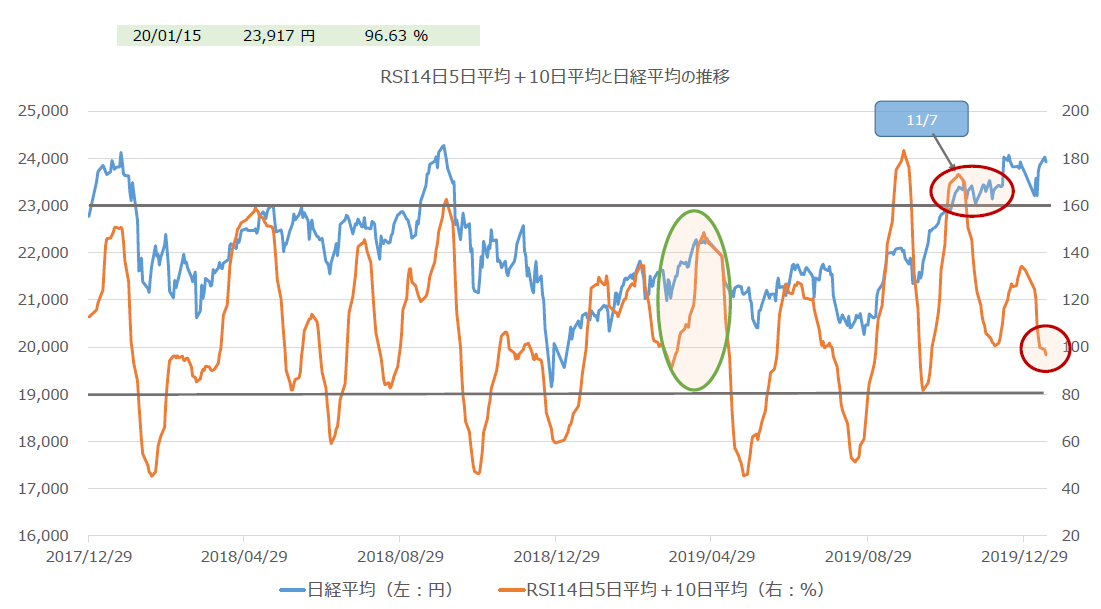
Looking at the most recent peak, as pointed out at the time, this is also hitting a ceiling at a mid-level; this mid-level (mid-level ceiling, bottom) → mid-level (bottom, ceiling) pattern is common, but this time it can be considered somewhat 'unusual'.
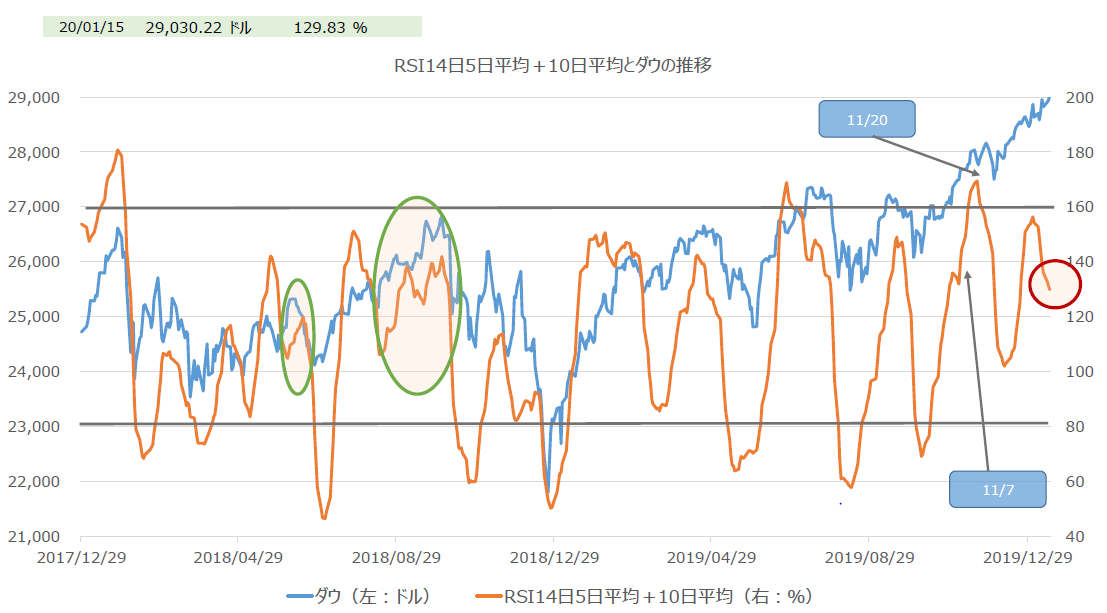
The reason is that in October and November, the Nikkei led the Dow technically, and it was only toward year-end that the Dow finally caught up (as noted). And as shown in Graph 2 for the Dow, the decline continues, but its level remains high (the numbers are given) at 129.83% as of this morning.
And what is extremely unusual is that around year-end and New Year, there are far more U.S. trading days than in Japan, yet U.S. indices (the Dow) continue falling while the Nikkei tries to bottom.
Remember last year's Golden Week. As a result, after May 5, when President Trump announced additional tariffs on China via Twitter, the market fell after the holidays; when the U.S. later rebounded, Japan's lack of trading days caused technical lag, resulting in a period during which it could not recover (as noted). This time too, one would expect the Nikkei RSI total to continue to fall due to the lack of trading days.
However, the reason it did not follow that path lies in the position of the recent peak (the Dow's auxiliary line was around 160%, whereas the Nikkei's level was not even 140%). Therefore, the current bottoming of the Nikkei RSI is unlikely to come with a 'buy' signal.


