

Shou Jouko's Rise Ideology ~ Answering Questions from Readers ~
There were questions from readers
About Capcom
9697 Capcom
5-minute chart
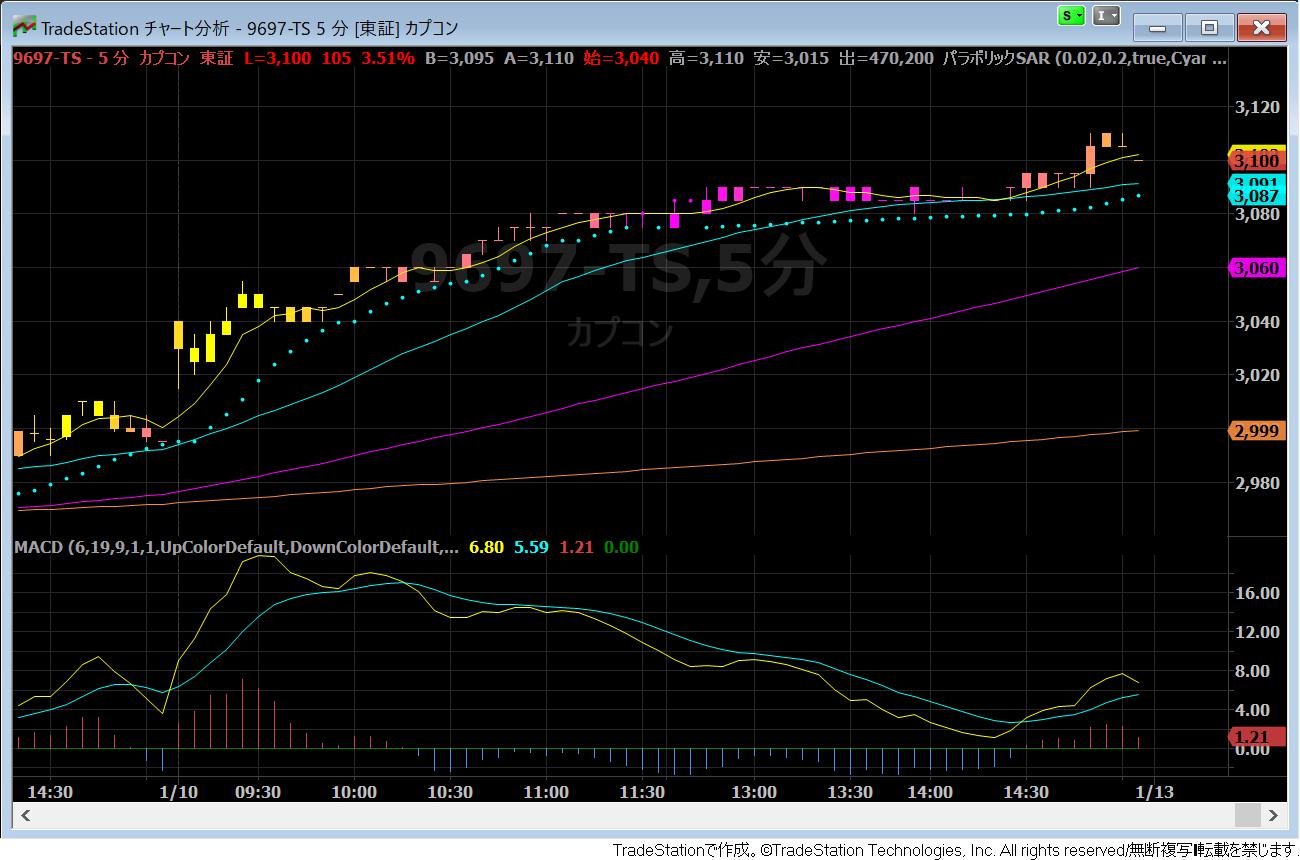
As you can see from this 5-minute chart,
it has been rising steadily since the breakout.
However, the MACD is bearish, isn’t it?
On the other hand, the Parabolic indicator is moving in a light blue color indicating an uptrend.
The reader’s question was,
In such a case, how far will the grip extend?
That was the content.
Indeed, in this situation, what should one do?
Many people may worry about this
What a very good question!!
First, one thing you must keep in mind is
that oscillators like RSI and Stochastic
“may not function properly.”
This is a weakness of all oscillator-type indicators, and
an event you must absolutely know about.
Even when an oscillator indicates being overbought,
the stock price may continue to reach new highs… which happens quite often,
and in cases like this, it may “not function” or become an “inversion phenomenon.”
And there are deceiving elements within this inversion phenomenon, which makes it tricky.
Therefore, as you pointed out,
if the oscillator is not functioning,
we rely on trend-following indicators to judge,
so using the Parabolic for judgment is the correct approach.
In general terms above
What I want to convey is the in-and-out rule of the Kirameki Chart
For day trading, first I look at the daily chart
9697 Capcom
Daily chart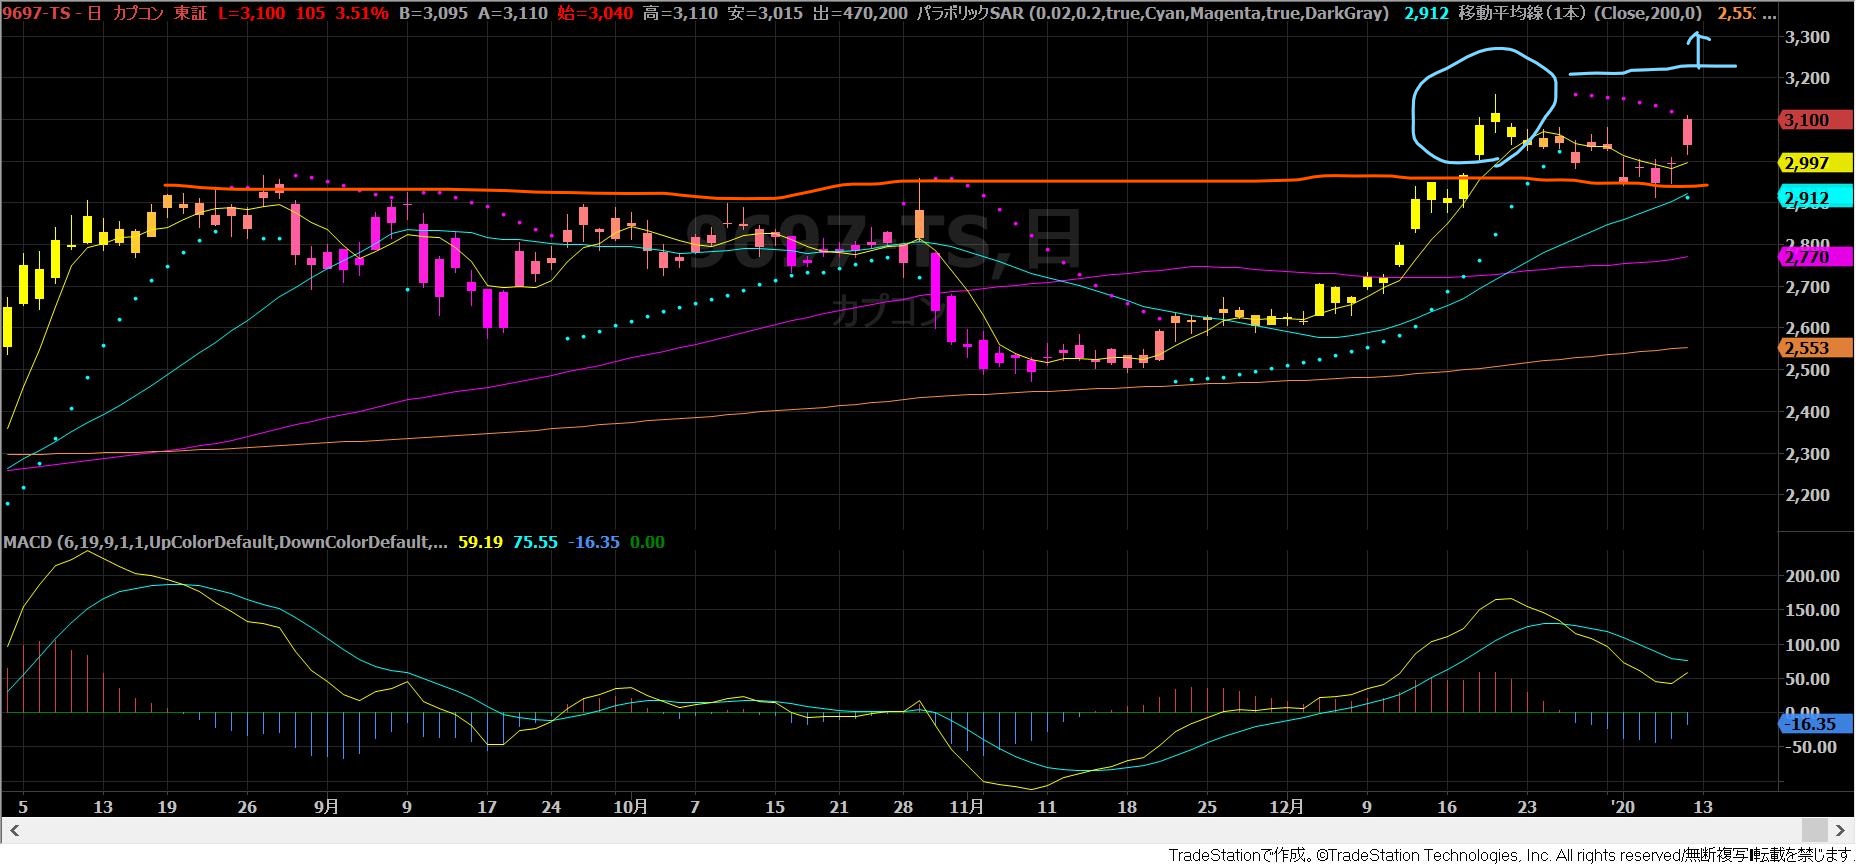
The important turning point is the orange line
If you break through that,
and then pull back, and rise on that day
As an entry point, you would need to exceed the previous high
to surpass 3,200 yen, which is the key!
Once you surpass it,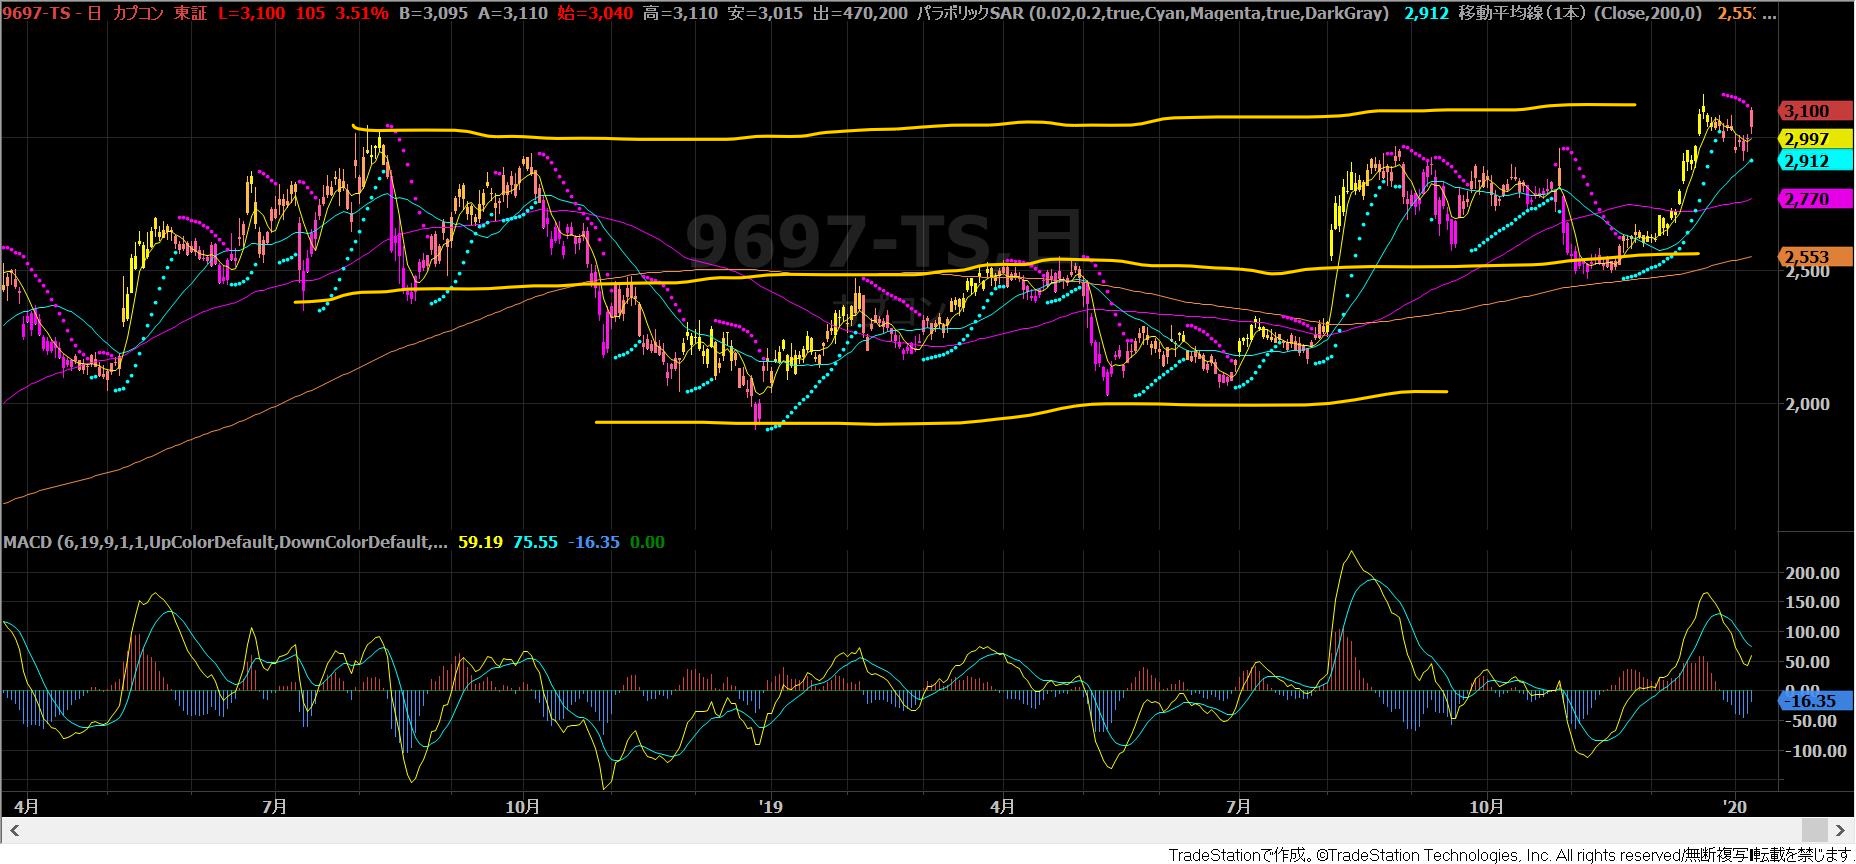
roughly, this is the image (the line is rough)
I think the next target value becomes visible
While watching this,
If you try to day trade by looking at the 5-minute chart…
This chart
Do you notice something?
Yes
There are many timeframes where trades have not been executed
That is what it means
For day trading, it is a condition that all candlesticks must be formed on the smaller timeframes
--- Choosing stocks without such points would help avoid liquidity risk
In the case of Capcom, it is less of a day-trading stock and more suitable as a swing stock when viewed on a daily chart
So, here, how would I trade it for day trading?
Regarding that,
since the smaller timeframes do not have properly formed candles, it is hard to judge, so
I will change the chart
(I will keep the exact change confidential)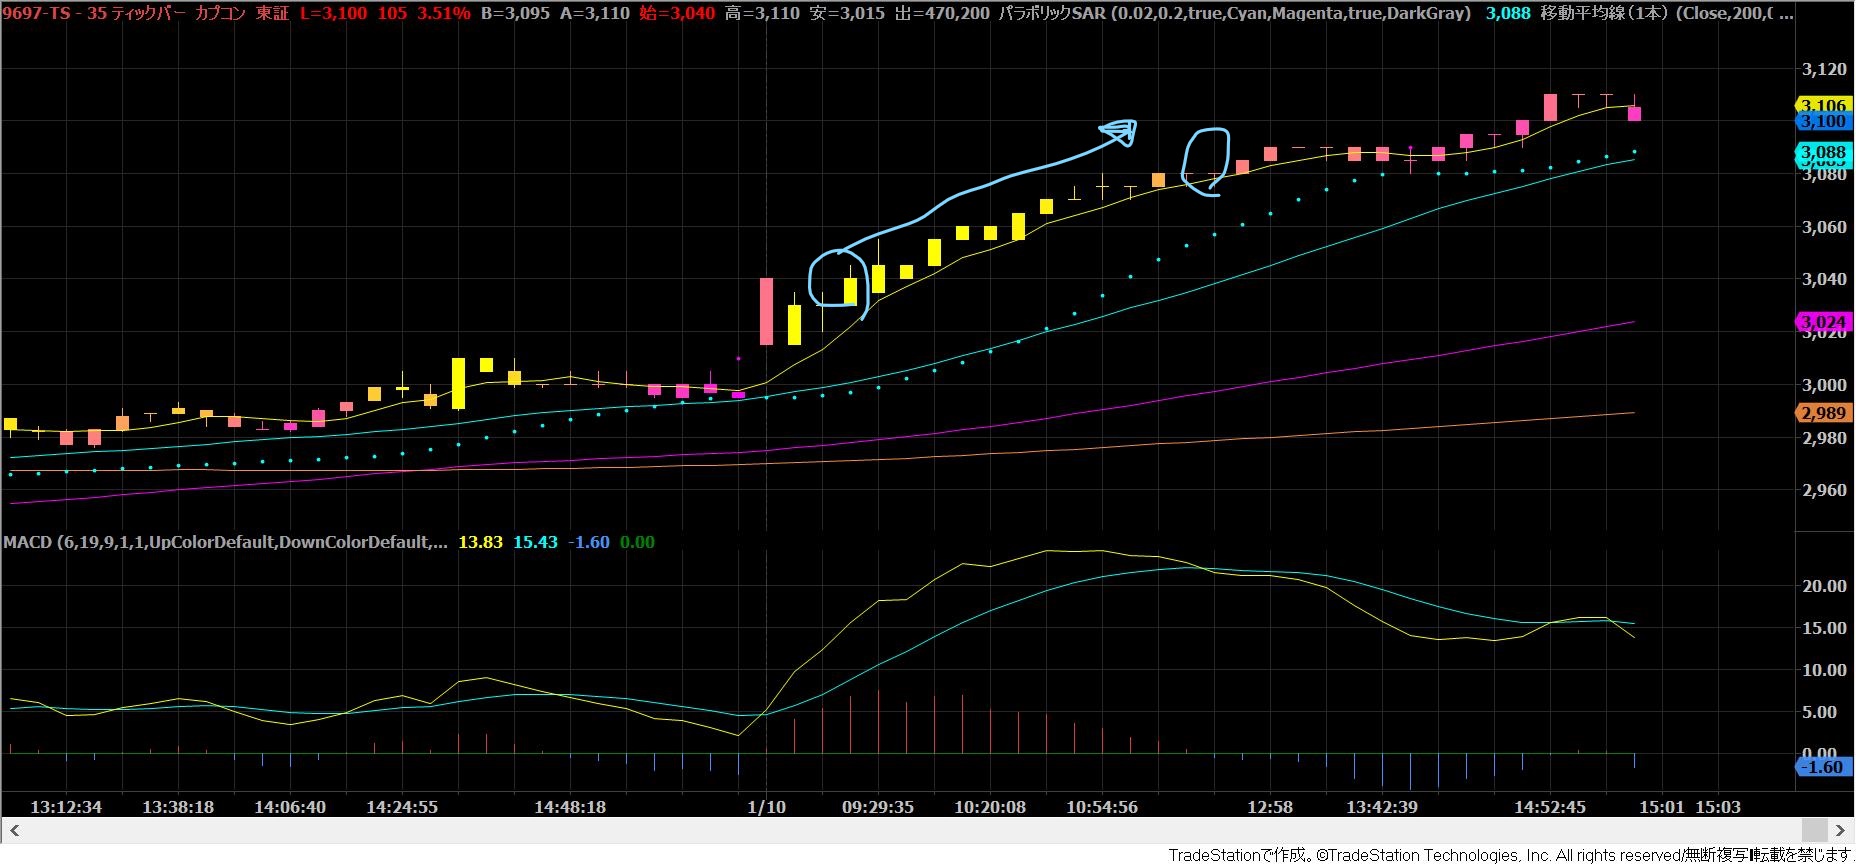
When I change the chart,
I would buy at 3,040 yen and sell at 3,080 yen
which would be a day trade, I think
As for grip,
it depends on the state of each stock,
In Capcom’s case,
since we want to push beyond 3,200 yen on the daily chart,
if it surpasses that, it might be possible to strengthen the grip to some extent, but
for now, the price is at a delicate level, so
it seems better to take small, incremental profits
Of course, this is my personal view,
it does not necessarily happen this way.
Investing is, please do so with your own judgment!!