Sell-side perspective on the Bitcoin market with a 97% win rate! A rules-based indicator that even beginners can use 'BTC ONE FULL'
Also equipped with sell-side signal display
As the name suggestsBTC ONE 'FULL' version!
A cryptocurrency specialist trader who crafted the logic
Easy for beginners to usehigh-precision BTC non-discretionary indicator
【Seller Profile】
Balflare
A cryptocurrency trader who focuses on BTC pairs and, as a technical analyst, also develops logic for automated bots and indicators.
Based on his own real trades, he designs investment rules and lists products that meet certain standards.
Seller pagehttps://www.gogojungle.co.jp/users/45858/
Bloghttps://blog.gogojungle.co.jp/yossycoin/
【Product Highlights】
・No chart software installation or setup required
・Charts use the popular TradingView
・Notified by email before trading opportunities
・For swing trading
・Comprehensive user manual and free updates
Basic specifications and support details are the same as the previous 'BTC ONE'.
参考:紹介記事⇒Bitcoin indicator 'BTC ONE' with 100% win rate over the last 3 months, with signals viewable on mobile
https://www.gogojungle.co.jp/finance/navi/15/17326/
The usage is simple and straightforward; as long as you have an environment where you can view cloud-based charts in a browser, you're ready. You can view it on a PC as well as tablets and smartphones.
【マニュアルの内容】
・Dedicated chart usage
・Basic operations
・How to use signals [Basic]
・Early exit patterns
・Automatic alerts
・Alert submission form
・Order methods
・Chart management
・Entry filters
・Notes on usage
This can also be viewed by purchasing the BTC ONE version.
【実際のチャート画面を確認】
We checked a chart where signals were actually appearing. (As of 2019-12-18 13:00)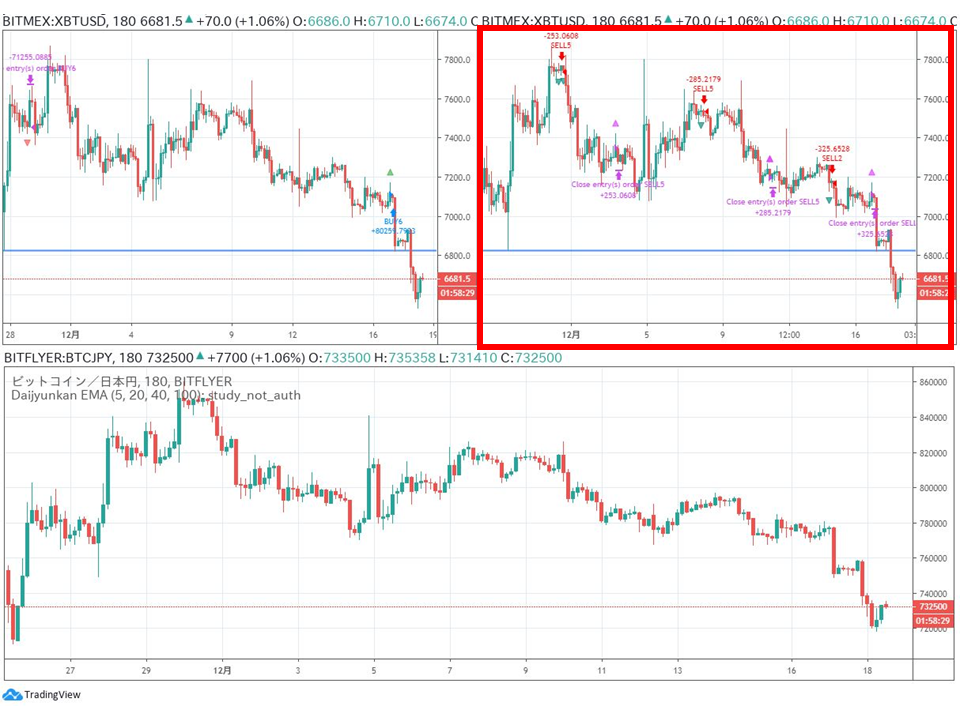
Left: BITMEX's XBTUSD (BTCUSD futures) long chart
Right: BITMEX's XBTUSD (BTCUSD futures) short chart
Bottom: bitFlyer's BTCJPY chart
Arrows are displayed on the upper BITMEX XBTUSD chart.
In addition to the chart of the previously introduced 'BTC ONE', there is a chart where short trading signals can be confirmed (image in red frame) located at the upper right.
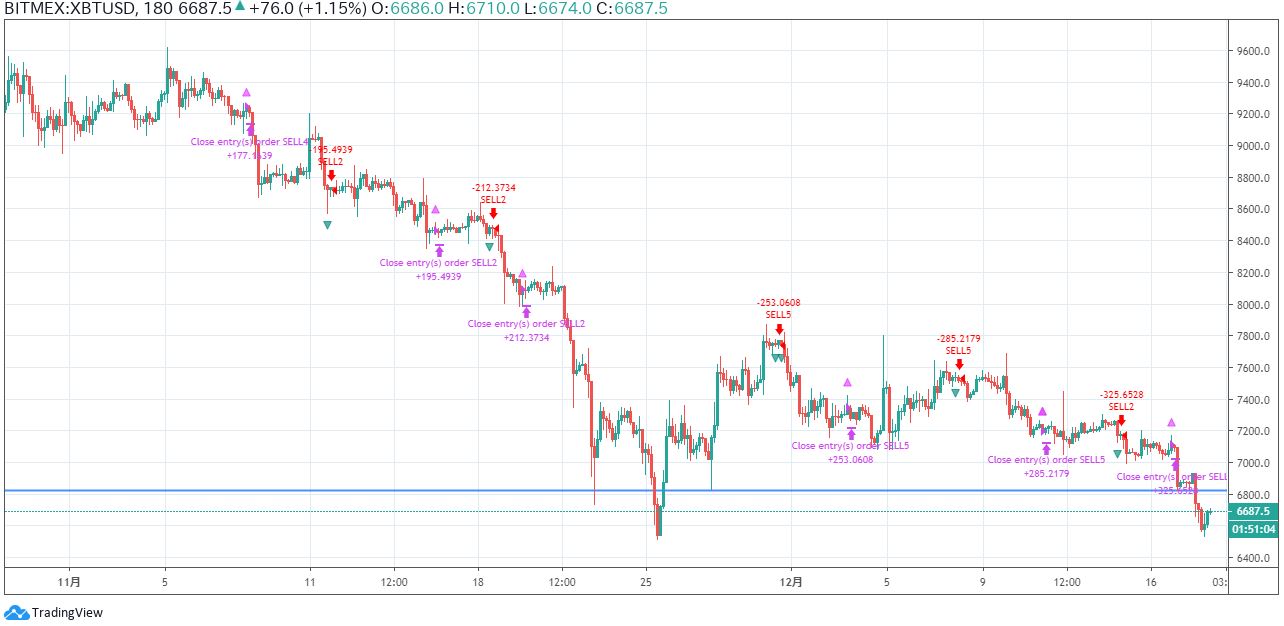
The red arrows indicate entry timing signals,andthe purple indicate exit timing signals.
Since Novemberin a downtrend, it is adept at catching declines from retracements.
【Past & Recent Performance Data】
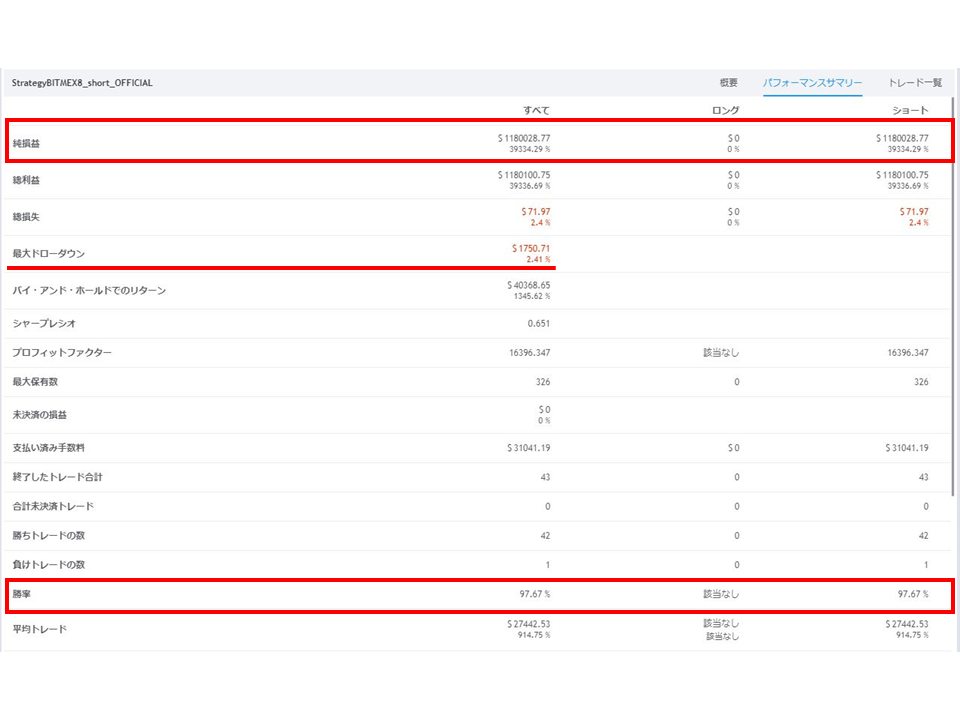
This is the trading history when the indicator's sign logic displayed on the chart is run as a strategy (as of 2019-12-18 13:00).
Win rate 97% and,profitability andlow maximum drawdown are noteworthy as well.
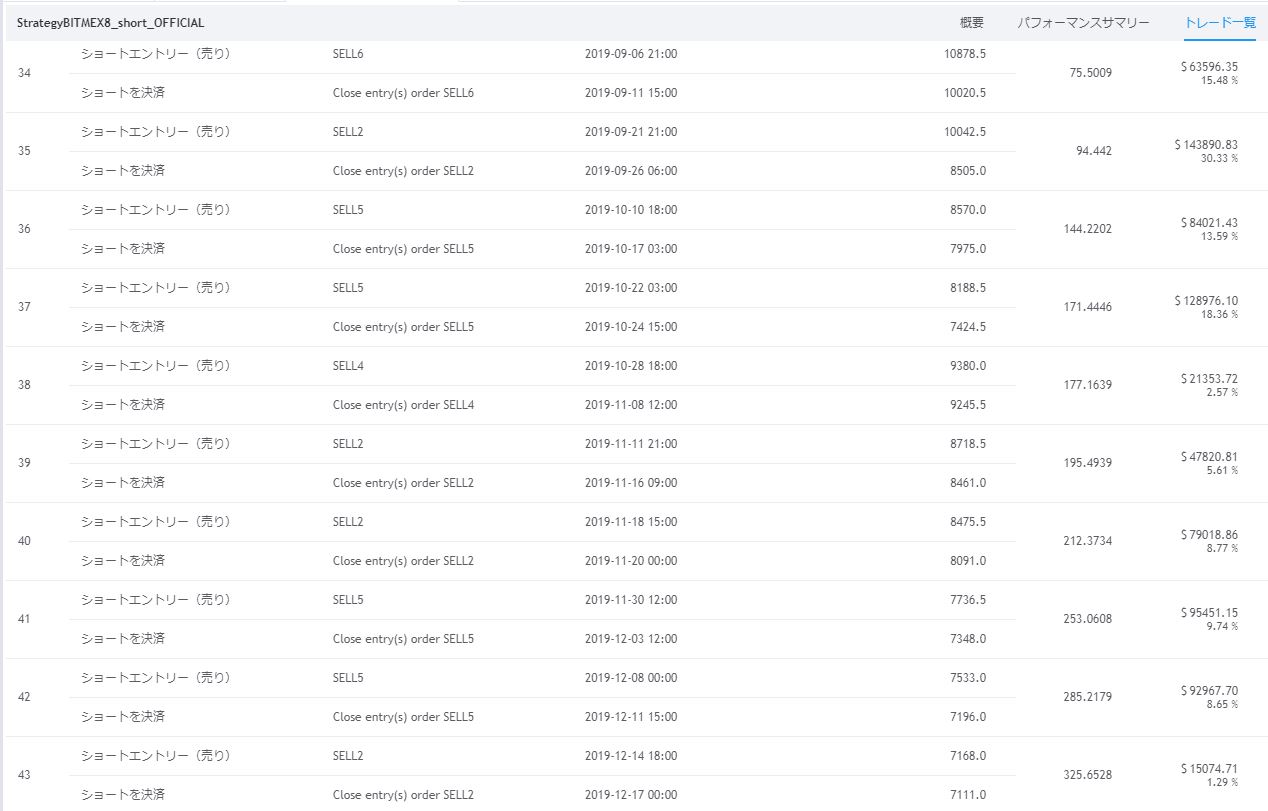
The most recent 10 trades.
A swing-trade oriented logic yields about 10 opportunities in the four months since early September, roughly 2–3 per month.
![[検証データ公開中] 本格ツールを手に入れましょう。 収益増、安定したパフォーマンス、低リスク。](https://img.gogojungle.co.jp/products/21984/banners/1/4)
![[検証データ公開中] 本格ツールを手に入れましょう。 収益増、安定したパフォーマンス、低リスク。 | GogoJungle](https://www.gogojungle.co.jp/re/img/hYzDDqOd1Zkd1f3)