

View the 301st–350th place in the management indicators ranking based on the November 2019 standard announced in Mr. Tetsuo Inoue's newsletter!
Mr. Tetsuo Inoue's newsletter provides excellent market analysis. This time, we have selected from recently distributed items and written an article. This will be useful for your investment activities, so please take advantage of it.
(The following is the full text from the newsletter 'Market Trend 931' distributed on December 11.)
(Repost)
To explain this ranking, it is constructed quantitatively using only the financial figures disclosed by companies, and I have been doing this for more than a decade on a quarterly basis. The reason I did this is that the hedge funds and mutual funds I managed operated systematically based on this ranking sheet, buying the top 200 stocks and selling the bottom 200.
This ranking is prepared quarterly, but every year, by May, once the full-year results for companies with March-year ends have been announced, the previous year's final ranking is determined.
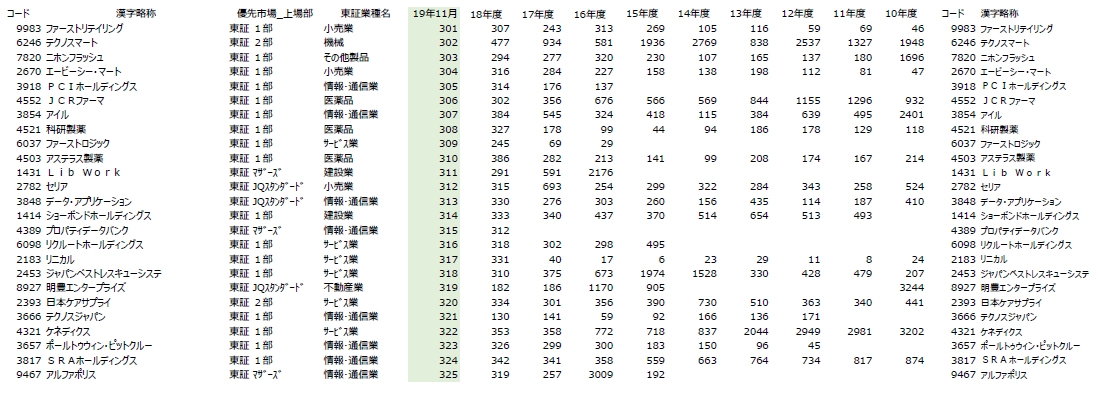
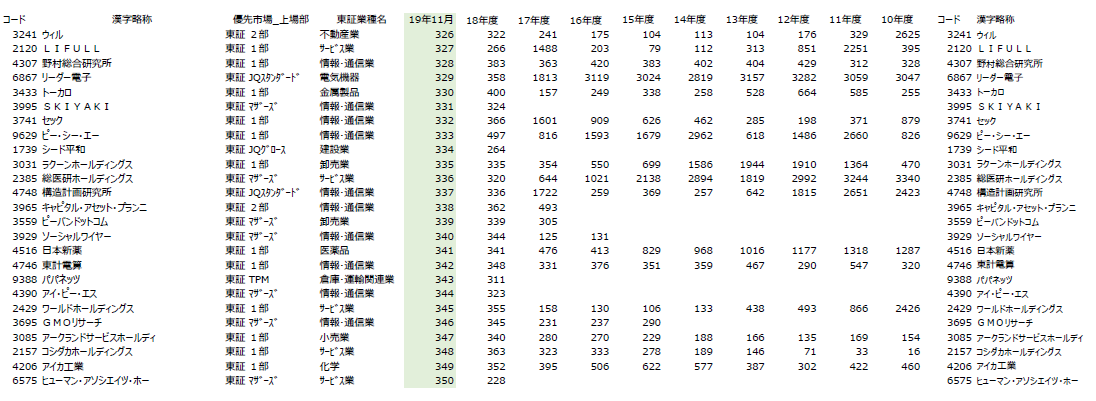
In the list distributed today, the columns on the far right show FY 2010 and FY 2011, which correspond to the May 2011 and May 2012 bases, respectively. The 'November 2019' on the far left is the most recent ranking reflecting the mid-year figures for March-year-end stocks (second-quarter results), and the one immediately to its right, FY 2018, refers to the May 2019 base.
Therefore, if these two rankings differ greatly, it means there have been significant changes in performance or performance outlook over the past six months.
The "Management Indicator Ranking" refers to the ranking by the "Overall Management Indicator Points." For this fiscal year, the number of target companies is 3,408. Note that among the 33 sectors of the Tokyo Stock Exchange, the four financial sectors (Banking, Securities & Commodities, Insurance, and Other Financials) are viewed as having different accounting standards from ordinary firms, and are not included in the universe.
The "Overall Management Indicator Points" are the total points across four major categories. Those four categories are: "Growth" (calculated by comparing growth in sales and profits over the most recent three periods with the previous period), "Return on Capital" (ROE, ROA—focused on the profits generated by capital), "Sales Profit Margin" (the profit margin for operating income, ordinary income, and net income attributable to the parent company shareholders, relative to sales), and "Healthy Dividend Payout" (the "true dividend payout," which I call DOE, calculated as the payout ratio multiplied by ROE and by the payout ratio).
Starting Friday, 12/6, I am presenting the top 500 companies from the most recent ranking daily, 50 at a time. I hope this will help you study individual stocks. Please visit the top companies' websites to learn what they do and what growth strategies they are pursuing, and increase the number of "talkable stocks." In stock selection, those with more "talkable stocks" tend to win.
<画像1>
<画像2>
Tetsuo Inoue's Salon →https://www.gogojungle.co.jp/finance/salons/9154


