This will make you a notch above the average FX trader! MT4 Cycle Theory Indicator
The market is formed by price movements up and down,[Cycle Theory]used by FX traders, how many are there?FX traders, how many are there?
First, Cycle Theory, as the name suggests "cycle = period,"is the idea that in a market that repeatedly moves up and down, a single cycle is defined as the interval between successive lows..
If you incorporate this Cycle Theory into your method, you may be able to read the market's rhythm and trade more easily, don't you think?
However, no matter how much you reference Cycle Theory, actually counting candlesticks is very time-consuming.
For those who have mastered it, there’s no problem, but Cycle Theory beginners often shy away, saying「takes time」「it's a hassle」.
Such “hassle” is gradually being alleviated by indicators that have recently gained popularity!
(and they're incredibly cheap compared with other indicators…)
Cycle Theory Simple Count


Using this indicator, it not only automatically counts candlesticks, but also offers several handy uses, which I will introduce in order.
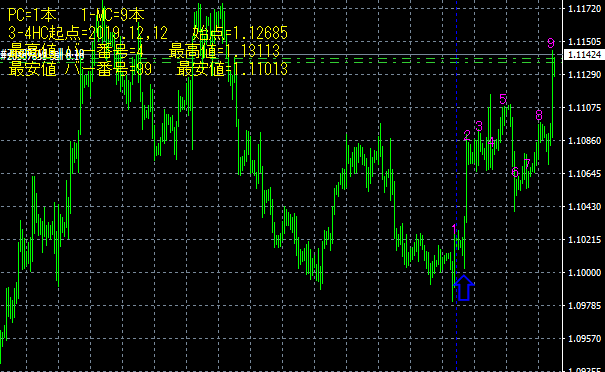
◆How to Use ①◆
First, the normal function of counting candlesticks by setting a starting point.
MT4 on a 4-hour chart, install the indicator, and change the parameters from the default values as follows.
・PC Starting point: Date input (YYYY,MM,DD)
・MC-1 Starting point: Date input (YYYY,MM,DD)
・4HC-1 Starting point: Date input (YYYY,MM,DD)
Also, if the numbers look dense and hard to read,
・Even-step display:true
Setting it to true will display the counts every other one,
・Number font size
Changing it will also adjust the size of the numbers being counted, making it easier to read.
The current information is displayed in the top-left of the chart, and you can also adjust its position and color.
Set it to a color that is easy to see against the MT4 background.
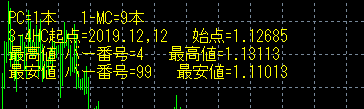
I use it with settings like this.
・Result display font color:Yellow
・Result display font size:12
◆How to Use ②◆
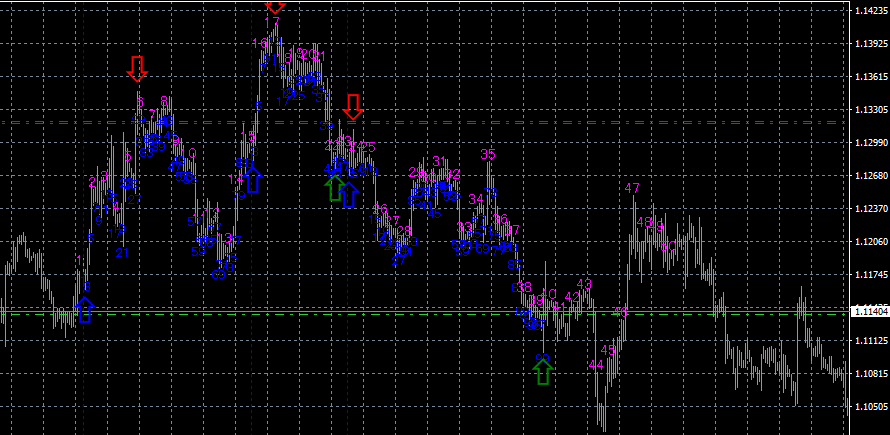
Next, it can also be used for cycle analysis.
If you set the starting cycle bottom date as a parameter, arrows appear at the starting point (blue), and arrows for the subsequent high (red) and low (green) within the cycle.
Color changes are of course also possible.
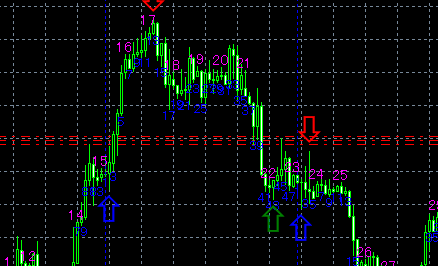
The number of candlesticks to the cycle bottom varies by timeframe, but for a 4-hour cycle, one cycle is about 60–80 candles, so while checking the current information, if the price breaches the bottom line of the lowest price between the 60th and 80th candles, that could indicate the bottom of the cycle (one cycle completed).
◆Multi-Time Frame Analysis◆
It is possible to perform cycle analysis across multiple timeframes simultaneously on MT4.
Even without opening multiple charts, if you input the starting date in the parameters, you can obtain information such as the Primary Cycle (weekly) and Major Cycle (daily) on a single chart.This information is also displayed in the top-left, and you can see at a glance which cycle you are in, which is convenient.
You may think, "This looks difficult..." after reading the article, but in practice once you get used to it, you can set the parameters quickly.
Everyone, master Cycle Theory andtake your FX trading to the next levelas antrader and aim higher!


Written by Kuwabara