Financial Instruments Business Operator Kanto Finance Bureau Director (Kinsho) No. 1960 / Membership Association Japan Investment Advisers Association Membership No. 012-02323Go to GogoJungle Home
Three technical analysis tools to determine the target price: Dow Theory, Elliott, P&F
Dow Theory, Elliott Wave, Fibonacci Retracement... If you are studying trading, these are terms you will inevitably encounter, and isn’t it a kind of technical analysis you’ve surely tried to verify whether you can apply to your trading?
First, I would like to briefly look at its history and how it is used.
What is Dow Theory:
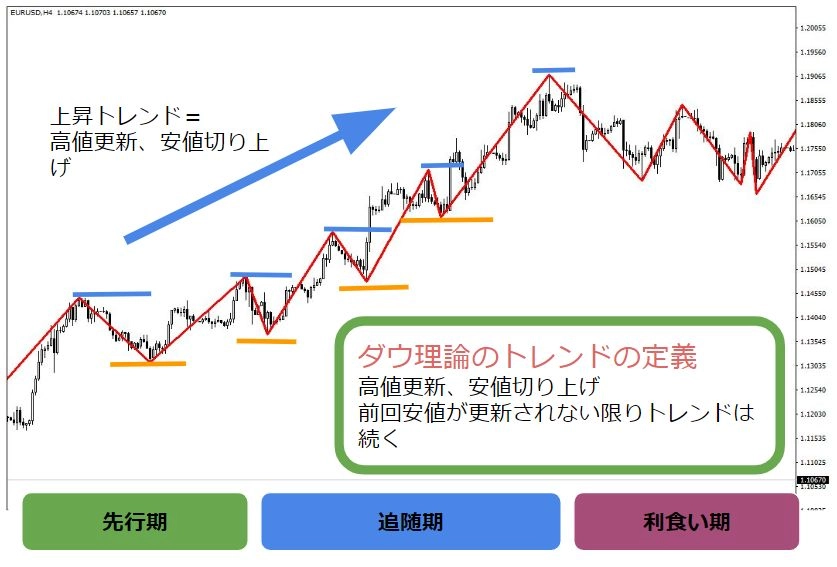
Dow Theory is regarded as the foundation of technical analysis, said to be indispensable for discussing the market. Proposed in the 19th century by Charles Dow, it is a theory for evaluating price movements in the market and consists of six basic principles.
1) The averages discount all information -The idea that every event, from economic indicators to unforeseen events like natural disasters, is reflected in market prices. 2) There are three kinds of trends -1. Primary trend: cycles of one year to several years -2. Secondary trend: cycles of 3 weeks to 3 months -3. Minor trend: cycles shorter than 3 weeks
3) The primary trend consists of three phases -1. Accumulation phase -2. Public participation phase -3. Distribution phase
4) The averages must confirm each other 5) The trend must be confirmed by volume 6) The trend continues until a clear reversal signal occurs
And then, the Dow Theory was further developed into the technical theory of stock investing known as the “Elliott Wave” proposed by Ralph Nelson Elliott. Today, it is also frequently used in forex chart analysis.
Elliott Wave Theory:
◆In a market, there exists an “upward five-wave” and a “downward three-wave (A, B, C)”.
◆The third wave of a rally is never the shortest
◆Wave 2 does not fall below the starting point of Wave 1
◆Wave 4 does not pierce the high of Wave 1
◆The upward five waves typically rise higher than the third wave, but there are cases where they fail to surpass the third and fall back; this is called a “failing” fifth, which increases the likelihood of a market turning point. ◆When the trend is strong, the five-wave impulse may extend beyond the fifth wave; this is called an extension.
Elliott Wave is fractal (self-similar), with the characteristic that inside one large wave, smaller trend cycles are drawn.
Also, there are many wave “patterns (formations)” in Elliott Wave theory, often seen at market turning points.
Commonly heard “Double Top” and “Head and Shoulders” are patterns that appear as turning points in the market according to Elliott Wave theory.
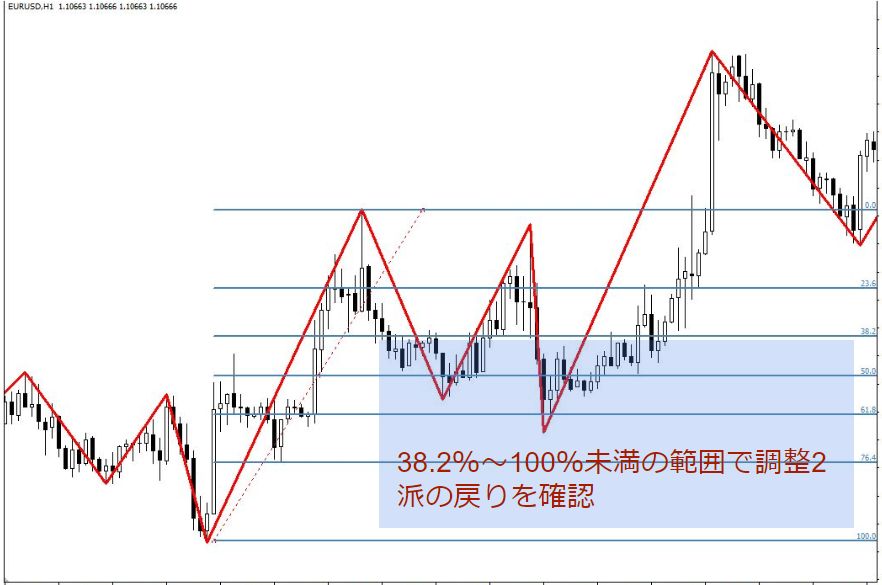
Furthermore, to determine how far the three-wave and five-wave sequences will extend, and how deep retracements will go, Fibonacci Retracement is used.
Rules for Wave 1 Retracement
When Wave 1 of an advance ends and you want to target the next three-wave advance, where should you pick up the pullback of the corrective wave 2?
The Elliott Wave rule is that Wave 2’s low must not breach the starting point (low) of Wave 1.
As for how much, if the retracement is between 38.2% and less than 100%, it is within the “pullback” range. Conversely, if it is less than 38.2%, it should be counted as an extension of Wave 1.
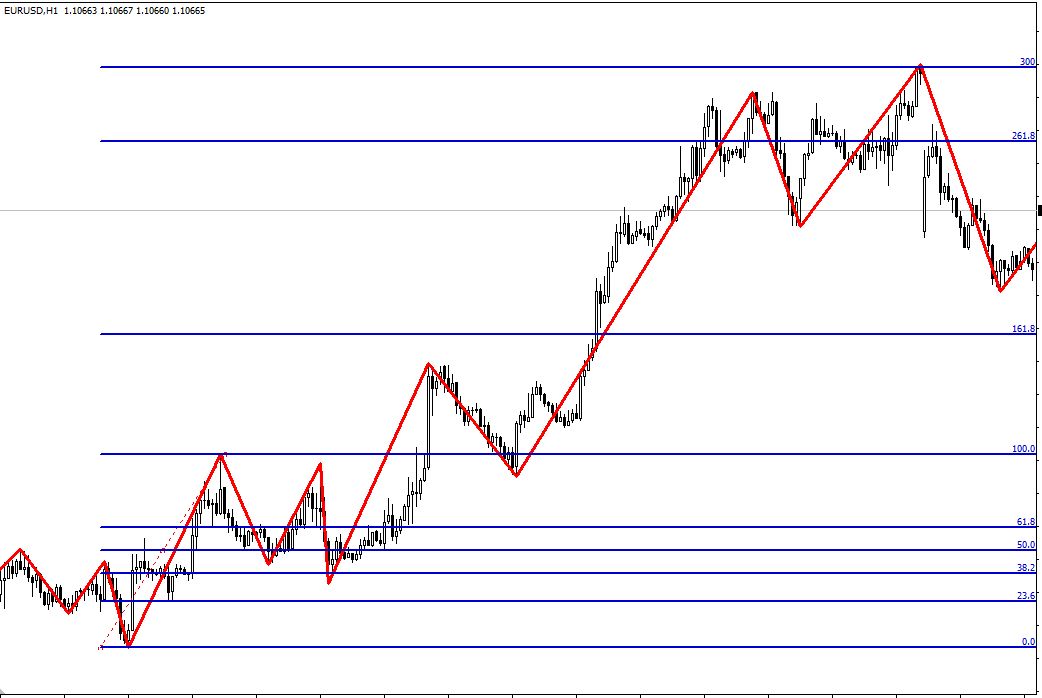
How far does Wave 3 extend?
In the “running phase,” how far Wave 3 extends?Often 1.618 times Wave 1, 2.618 times, or 3 times the end point of Wave 2It is common for Wave 3 to extend to three times the length of Wave 1.
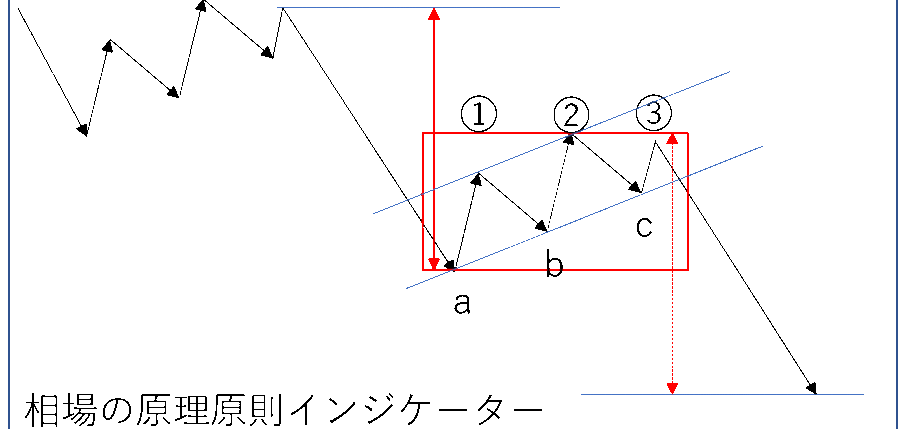
▲ Example where Wave 3 extended to three times the length of Wave 1
Problems with Elliott Wave
Looking at the examples so far, you might think, “If I catch Wave 1 and aim for Wave 3, it’s easy!” but
・Interpretation of waves varies between people (definitions of highs and lows)
・Wave counts differ depending on the time frame
・It often doesn’t go as the theory says
・There are many patterns to learn, making it easy to miss them
These drawbacks exist, and I think few people use Elliott Wave effectively.
However, the attraction is that you can roughly know target values in advance.
Because it can be used for entries, take-profits, and stop-loss bases, many would like to master it.
Among the many indicators on GoGoJungle, there aren’t many that are truly definitive, but
for those who want it, there may be something you’d think, “This is exactly what I wanted!!”
1) An indicator that automatically draws waves
“Market Wave”
An indicator that automatically draws waves for all applicable timeframes and higher timeframes.
While drawing waves takes time, you don’t have to count waves across all timeframes yourself, so the time spent on analysis will be incredibly shortened.
It can also display past resistance and support across each timeframe where price tends to extend, buy on dips, or sell on rallies.
2) An EA that derives the target rate for Elliott Wave and supports entry/exit decisions
“The Principles of the Market”
Here you must count waves yourself, but it automatically displays the target rates and retracement levels for those waves, making it easier to plan and trade.
Also, as an EA, it includes entry and exit functions, which is a plus. It is recommended for line traders as well.
Functions of The Principles of the Market
2. After displaying the waves, automatically display the Elliott Wave target rate
3. After displaying the waves, automatically display the retracement levels
4. Display target rates for flags, pennants, ranges, and triangles based on user actions
5. Detect breaks and touches of trendlines and horizontal lines with user actions and show arrows
6. Includes email notification to alert you of arrow displays
Also, using this tool, the seller kinchanbbh3 publishes daily trading scenarios in a monthly subscription investment navigation + content, so it can serve as a model for how to analyze.
▶ GBP/JPY scenario
▼ The Principles of the Market Indicator
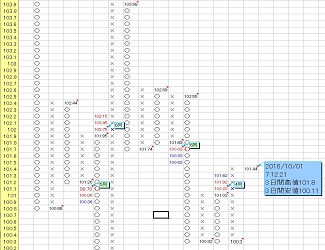
3) A tool to determine target prices using Point and Figure
Elliott Wave is somewhat separate from this, but for the purpose of knowing target attainment price, Point & Figure is a very effective technical analysis method. GoGoJungle also has a popular product using this P&F.
P&F used to be drawn by hand by recording price changes times days, but this tool allows analysis on MT4 with short timeframes like 15 minutes.
From users’ high ratings, its accuracy is evident.