12/1 Market environment recognition method using Winner
Thank you for your hard work^^
This is Nobushi.
We started in December with "Winner's eye"!
To many peopleIndicator version WinnerandEA version Winnerto be received,
I believe you now have the tools to contend with market environments.
In fact, I have received many messages from people saying they are making profits using their own methods or the methods described in the accompanying manuals,
which makes me very happy.
However, it is not enough to simply swallow whatever method others tell you to use
you must understand why that method works
what differences exist between the current market in which it works and markets where it does not
and that is what matters.
In other words, through this series
I hope many people (including those who do not use Winner) will develop a proper "discretion"
and learn how to survive in the world of the marketas the goal.
I, Nobushi, will reveal how I usually view the market!
Why can I enter without losing?
Why do I not get trapped by drawdowns...?
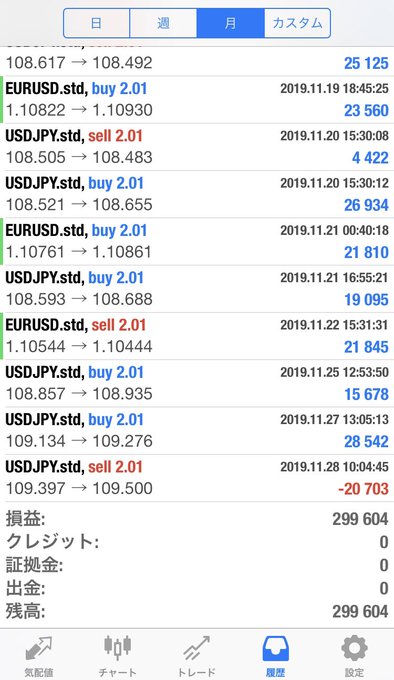
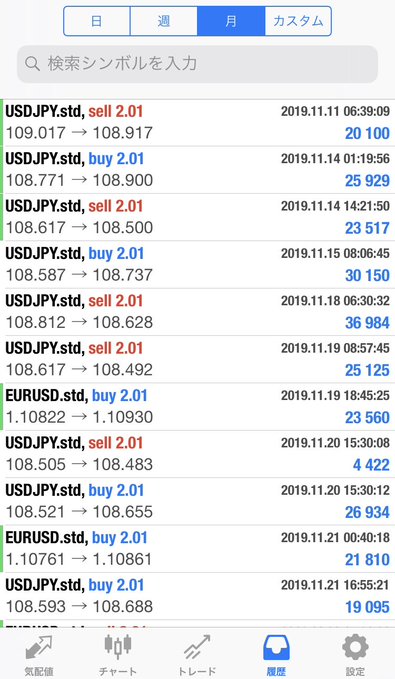
Last month's results were 14 take-profits and 1 stop
"No results from trades without basis"
Entries, holding periods, profit-taking, stop-losses, trailing profits, averaging in, and accidental exits
All actions have a basis!
Please use this as a reference, and I would love to receive your opinions and have lively discussions!
Now, let's quickly organize the market environment for the coming week!!
Below is the USD/JPY 15-minute chart from last weekend

Winner's arrow signs appear alternately up and down, right...
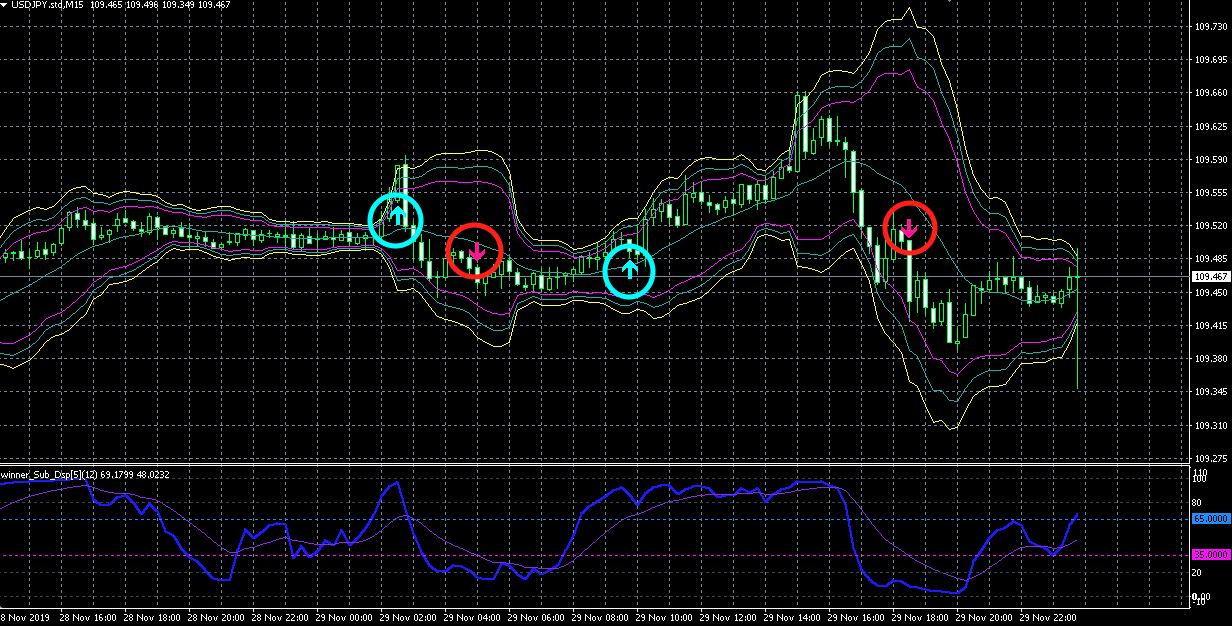
This phenomenon, needless to say, indicates a range-bound market has begun.
If you take the view simply, the market is either a "range" or a "trend"
I consider about 70-80% of the market to be "range," and currently we are in that 70-80%.
Since my style is predominantly "trend-following,"
I do not engage in such markets.
Now, let's look at the 1-hour higher timeframe!
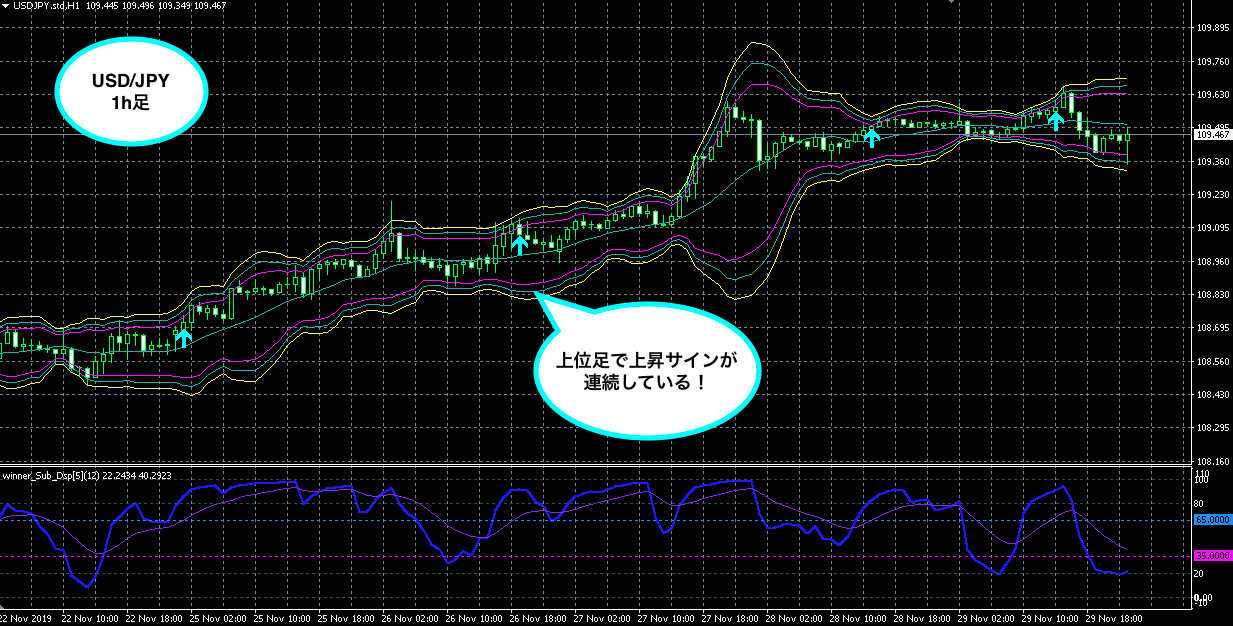
I see, I see
There are consecutive buy signals on Winner
and, based on the "Winner 2-wave theory" I advocate,
it shows that a long period of uptrend has continued, right?
In other words, the earlier 15-minute range is, from the higher timeframe's view,
"a temporary resting range"
or
"a range for a reversal"
which one it is, at this moment, no one knows, and
there is no need to know!
Because we won't trade in ranges anyway!
What matters is to picture the potential scenarios in your head if the price moves in either direction.
If the trend continues and the 15-minute chart shows two waves of buy signals,
keep an eye on the 1-hour signals as you go more long, and attack with confidence
with a deeper stop loss as well.
Conversely, if on the hourly basis a trend reversal is seen (for example, two waves of sell signals appear)
follow with a shallow stop loss!
Of course, only if the 15-minute chart also forms two waves of sell signals!
In this way, the original indicator "Winner" alone makes market condition recognition perfect.
You can narrow from entry scenario to stop-loss points!
Let's stay solid and go for the win next week too!!
I plan to regularly publish market strategies!
Comments and encouragement would be very motivating...!
Thank you in advance!