An EA that accumulates profits through grid trading, "Honeycomb Grid that rises rapidly when left unattended"
Recommended currency pair is USD/CHF
The logic is also excellent, including an exit feature
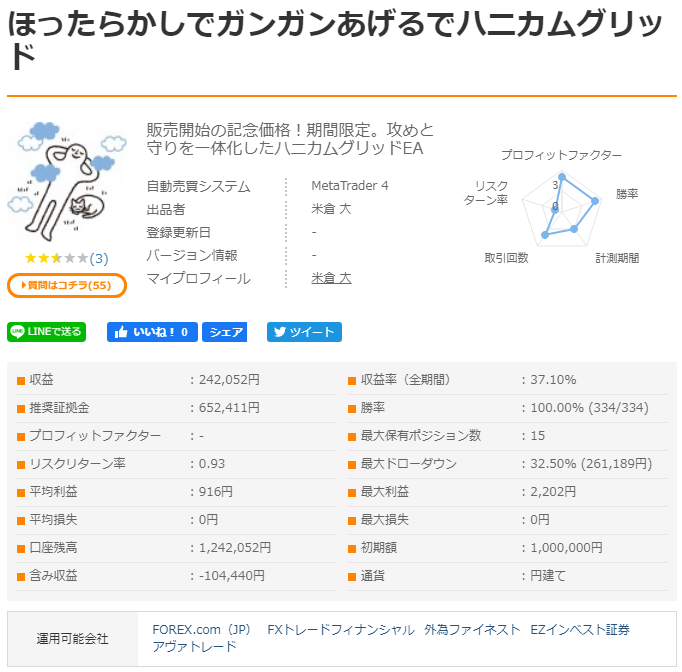
A grid trading EA that reliably earns profits
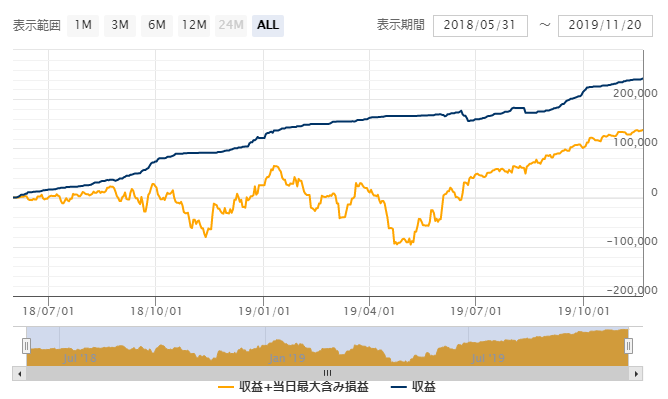
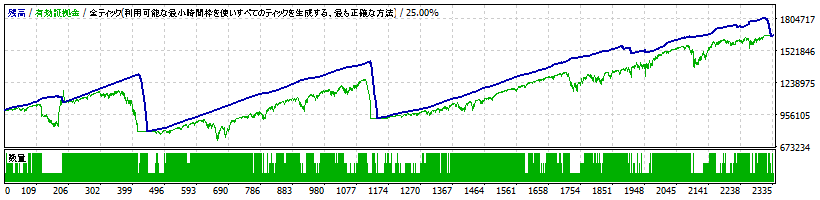
The forward period is about 1 year and 6 months. Since this is grid trading, there can be times when unrealized gains and losses grow large, but looking at the profits alone, it tends to rise steadily.
【Honeycomb Grid that Keeps Rising with Minimal Intervention Overview】
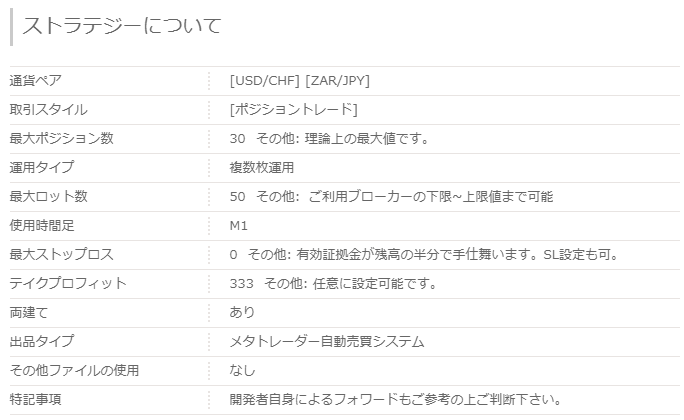
The recommended currency pair is USD/CHF. It also apparently supports USD/JPY. Logically, it is said to have a high edge on XAGUSD as well.
Note: as a measure against drawdown, it is advisable to keep more margin.
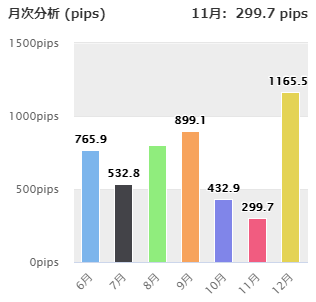
■Monthly Analysis
2019
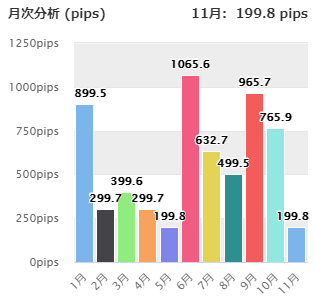
This is the monthly result for 2019. There were no losses from January to mid-November.
In June, more than 1000 pips were earned, and September also earned close to 1000 pips.
A total of 6,227.5 pips were earned, averaging about 566 pips per month, a very high amount of pips.
2018
This is the monthly result for 2018.
Here too, December earned more than 1000 pips. August, where the number is not shown, earned 799.20 pips.
A total of 4,895.12 pips were earned, with an average of 699.3 pips per month, achieving very high pip totals in both 2018 and 2019.
Honeycomb Grid
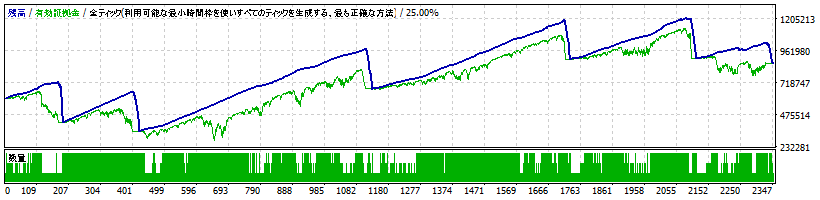
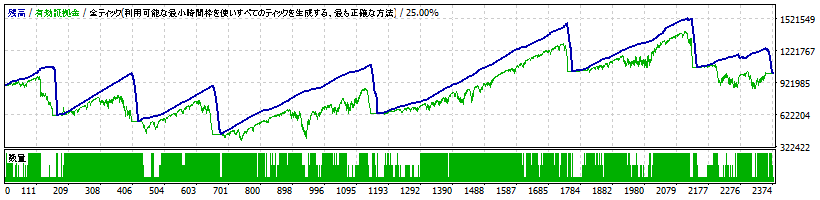
【Backtest Analysis】
Since the operating funds and parameters for the Honeycomb Grid are published, I ran several backtests using those settings.
The page is →https://xn--cck6c4a1b9azn.jp/?p=1015
・USD/CHF 2014-2018 600,000 yen
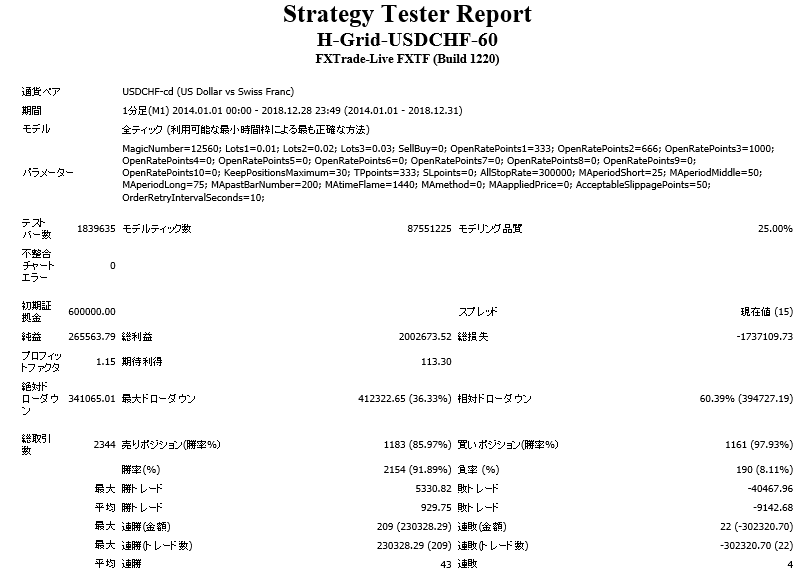

2014.01.01‐2018.12.31
Spread 15.0
Net profit +265,000 yen (annual average 53,000 yen)
Maximum drawdown -412,000 yen
Total trades 2344 (annual average 468)
Win rate 91.89%
PF 1.15
The annual return for this case is 8%.
・USD/CHF 2014-2018 900,000 yen


2014.01.01‐2018.12.31
Spread 15.0
Net profit +110,000 yen (annual average 22,000 yen)
Maximum drawdown -627,000 yen
Total trades 2371 (annual average 474)
Win rate 90.81%
PF 1.04
The annual return for this case is 2%.
・USD/CHF 2014-2018 1,200,000 yen
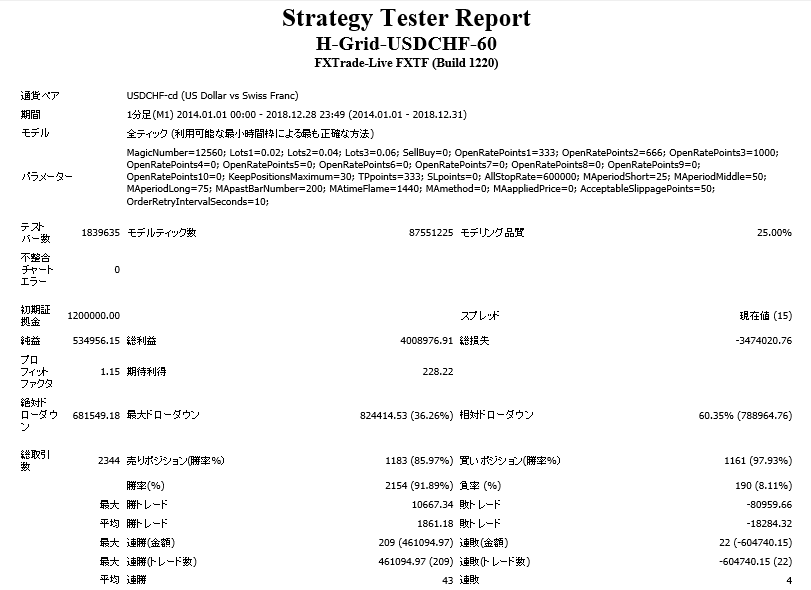


2014.01.01‐2018.12.31
Spread 15.0
Net profit +533,000 yen (annual average 107,000 yen)
Maximum drawdown -824,000 yen
Total trades 2344 (annual average 468)
Win rate 91.89%
PF 1.15
The annual return for this case is 9%.
・USD/CHF 2014-2018 1,800,000 yen
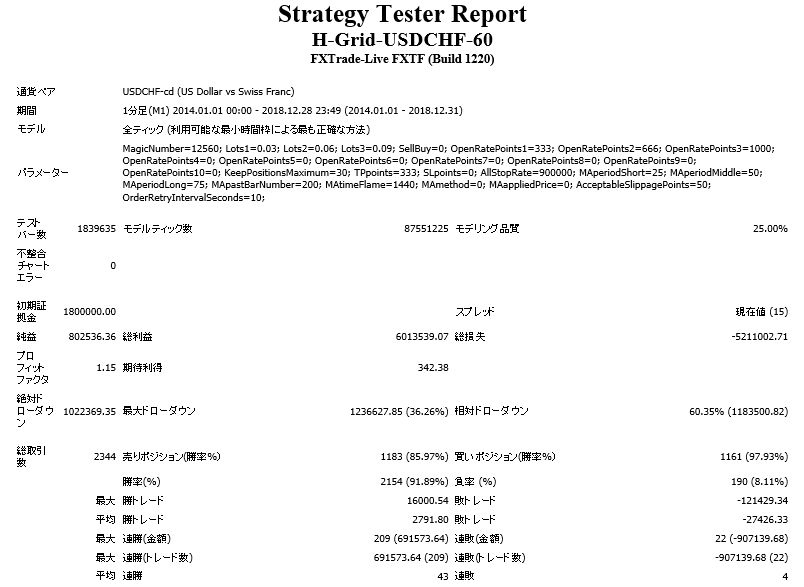


2014.01.01‐2018.12.31
Spread 15.0
Net profit +802,000 yen (annual average 100,000 yen)
Maximum drawdown -160,000 yen
Total trades 2344 (annual average 468)
Win rate 91.89%
PF 1.15
・USD/CHF 2014-2018 2,400,000 yen


2014.01.01‐2018.12.31
Spread 15.0
Net profit +1,068,000 yen (annual average 213,000 yen)
Maximum drawdown -1,649,000 yen
Total trades 2344 (annual average 468)
Win rate 91.89%
PF 1.15
The annual return for this case is 9%.
・USD/CHF 2014-2018 3,600,000 yen
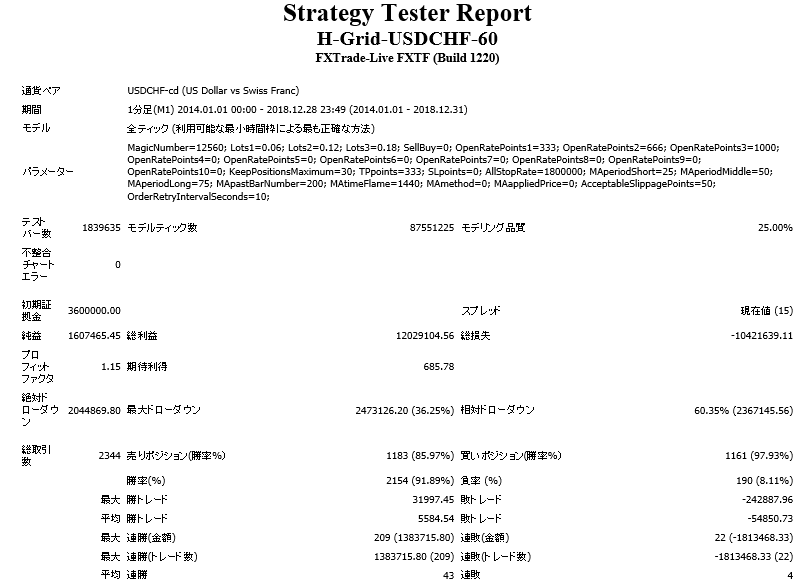


2014.01.01‐2018.12.31
Spread 15.0
Net profit +1,607,000 yen (annual average 321,000 yen)
Maximum drawdown -2,473,000 yen
Total trades 2344 (annual average 468)
Win rate 91.89%
PF 1.15
The annual return for this case is 9%.
※This backtest is for reference only, and users can freely set according to their trading strategy. Depending on the settings, it is possible to earn significant profits.
【Backtest Analysis 1 Example】
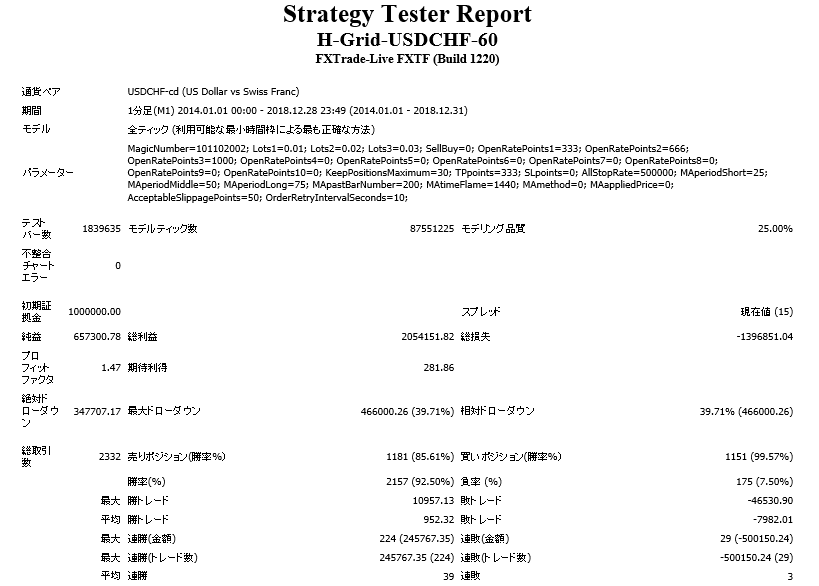

2014.01.01‐2018.12.31
Spread 15.0
Net profit +657,000 yen (annual average 131,000 yen)
Maximum drawdown -466,000 yen
Total trades 2332 (annual average 466)
Win rate 92.50%
PF 1.47
When changing settings and backtesting with an initial margin of 1,000,000 yen, the annual return was 13%.
I think the freedom to change settings is the advantage of this EA.
【Summary】
Forward testing shows the graph rising to the right, and pips have been accumulated very significantly over about two years.
Looking at backtests, the graph has some troughs, but generally trends upward to the right.
However, since unrealized P/L can become large, you should keep more margin for safety.
Modify the settings yourself and continue to accumulate profits.