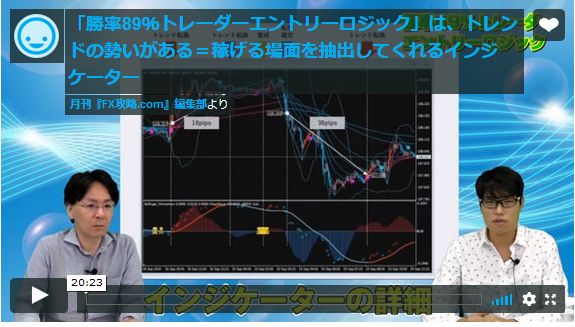
An indicator that enables reproducing the entry logic of an 89% win-rate trader has appeared!
Trend of turning timing and momentumDon't miss it
with outstanding visibilityindicator
89% win rate trader MURASE's trading know-how and
how to read the indicator and entry logic, with a PDF and video
discretionary trading power improves
【Seller Profile: MURASE】
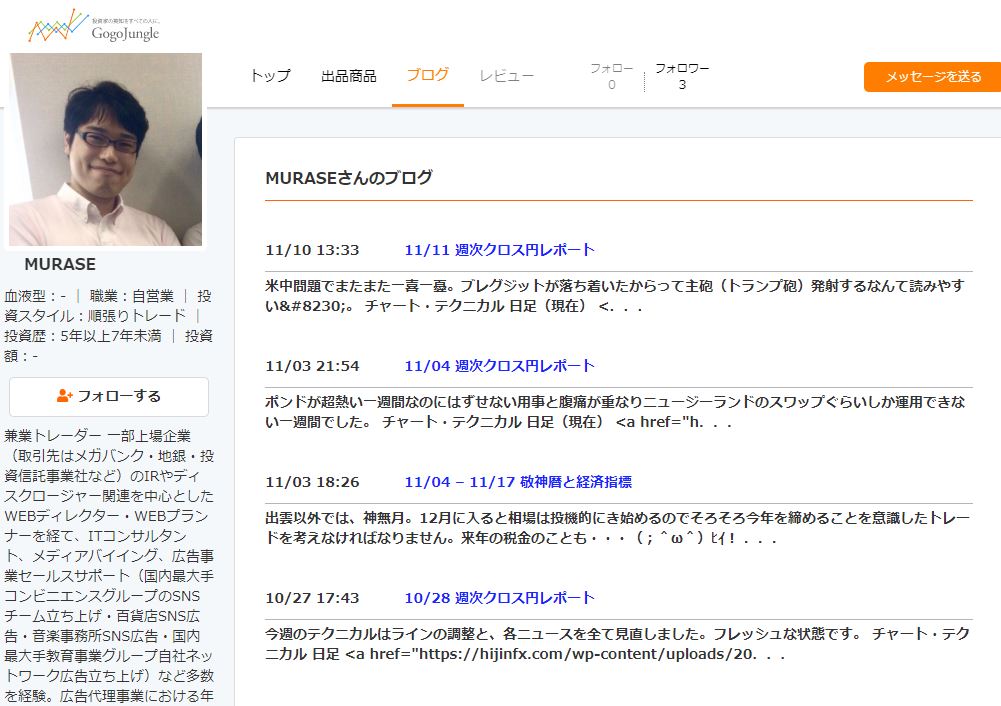
A part-time trader whose main job is as a marketing-centered web consultant.
Primarily scalping to day trading USD/JPY and GBP/JPY, restructured on a 3-month cycle; also trades stocks. An exceptional trader with an 89% win rate in 2019.
https://www.gogojungle.co.jp/users/182611
【Recommended trading style】
・Trading style suited to indicator useScalping to day trading using 5 to 15-minute timeframes
・Currency pairs
Those in which a trend is present
【Chart screen】
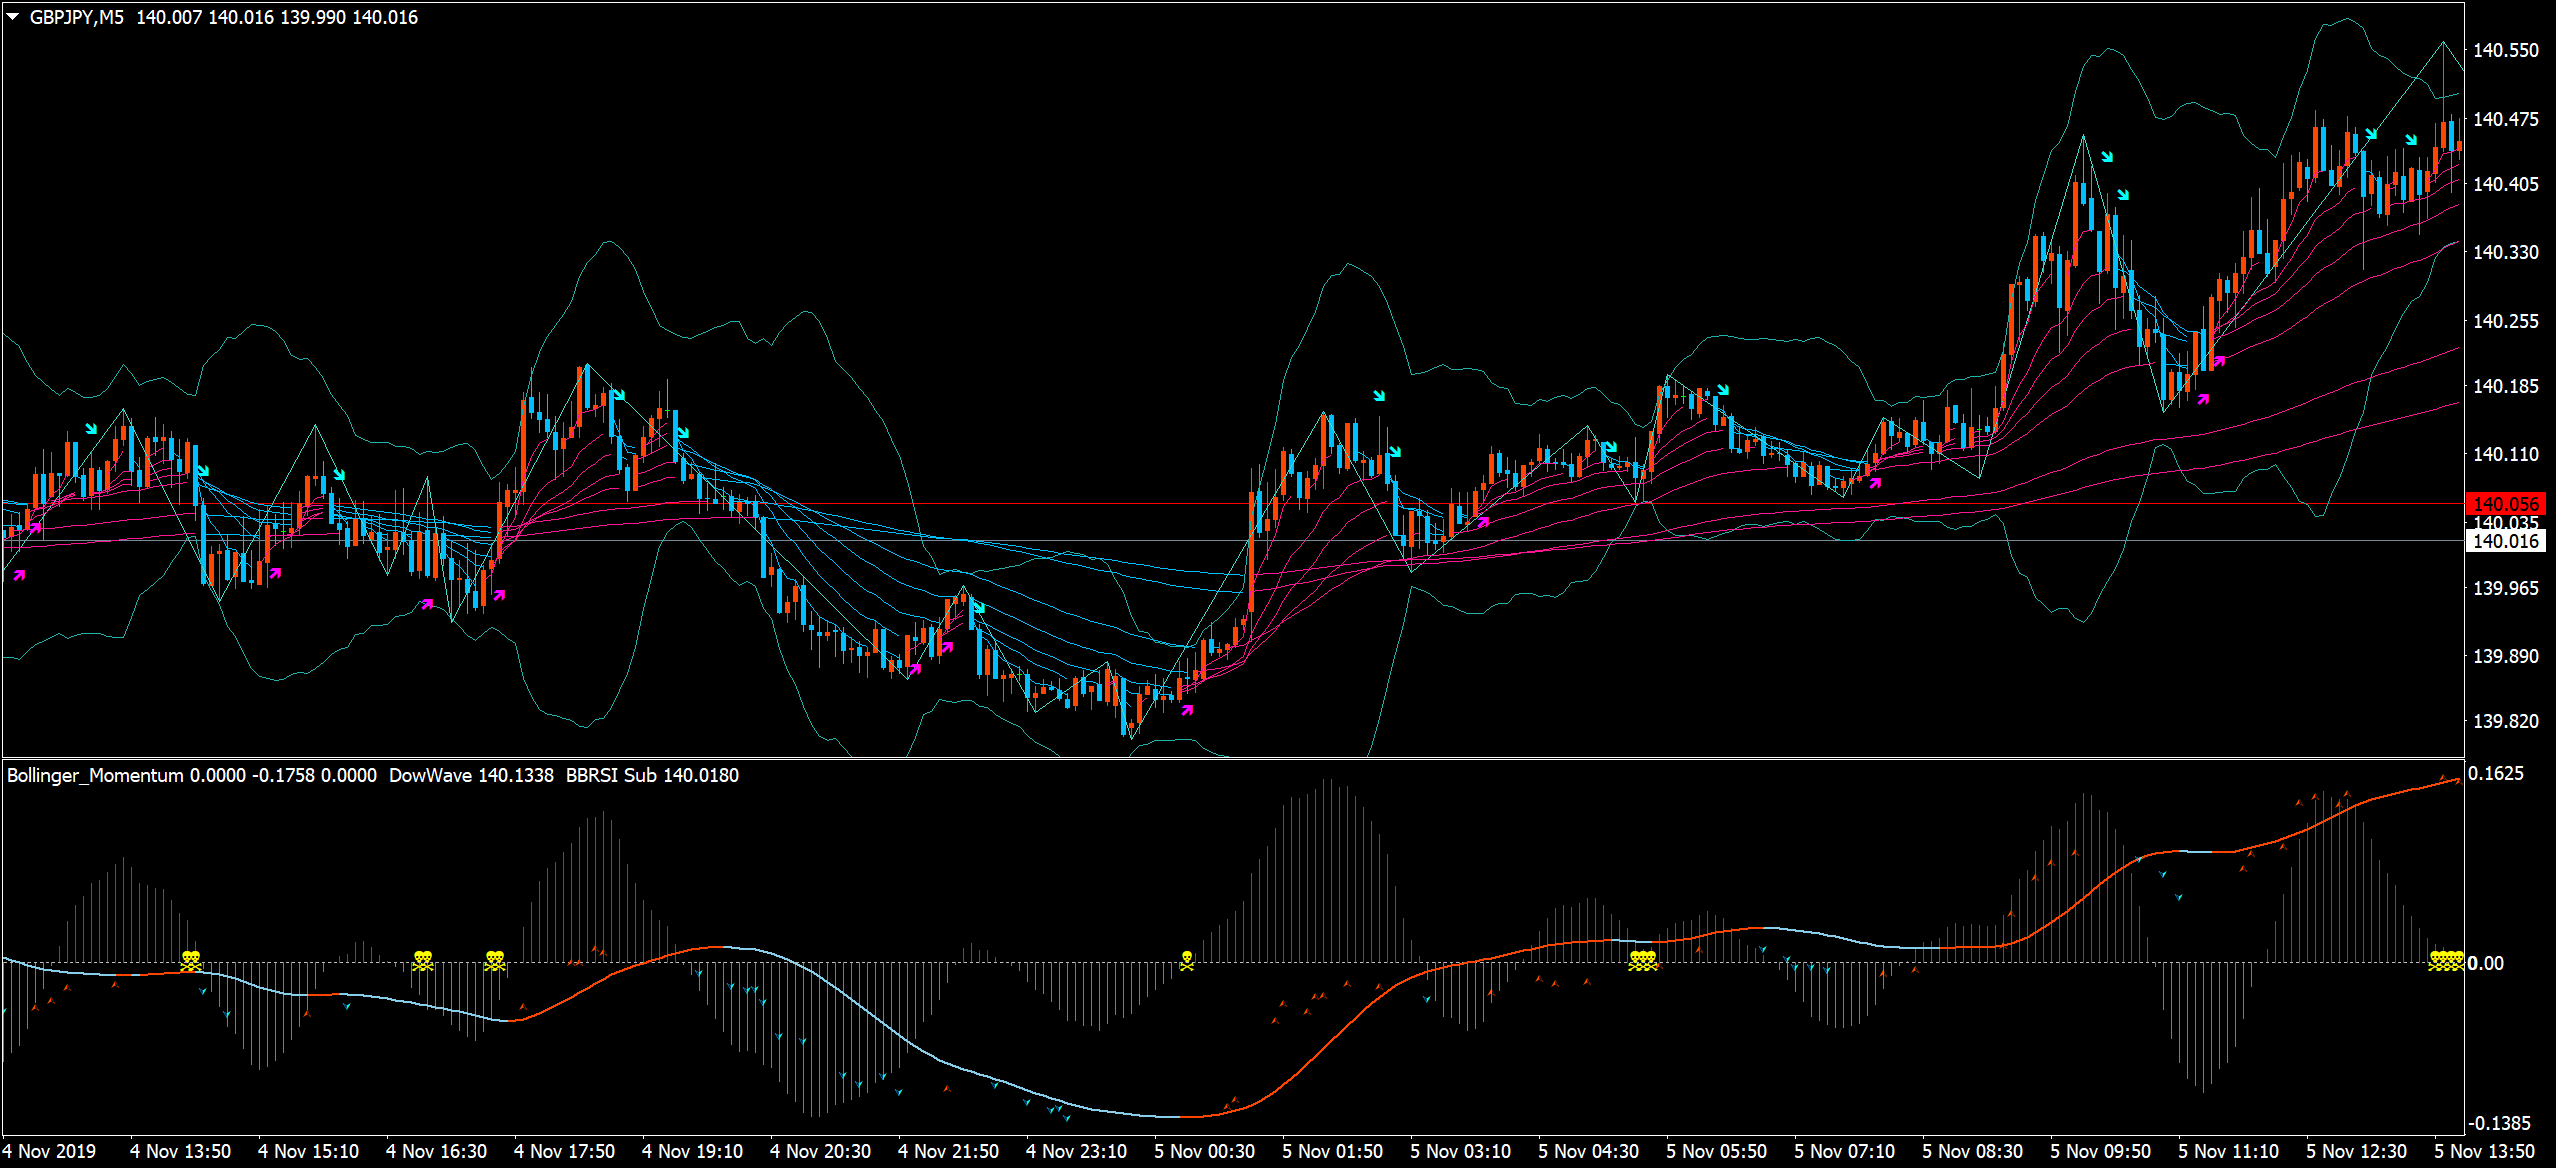
GBP 5-minute chart on November 4–5, 2019
【Indicator configuration when using the template】

This is the configuration when the product's indicators are set with a template.
On the main chart, in addition to ZigZag and bands and multiple moving averages, there are upward/downward sign displays as well.
1. Main chart
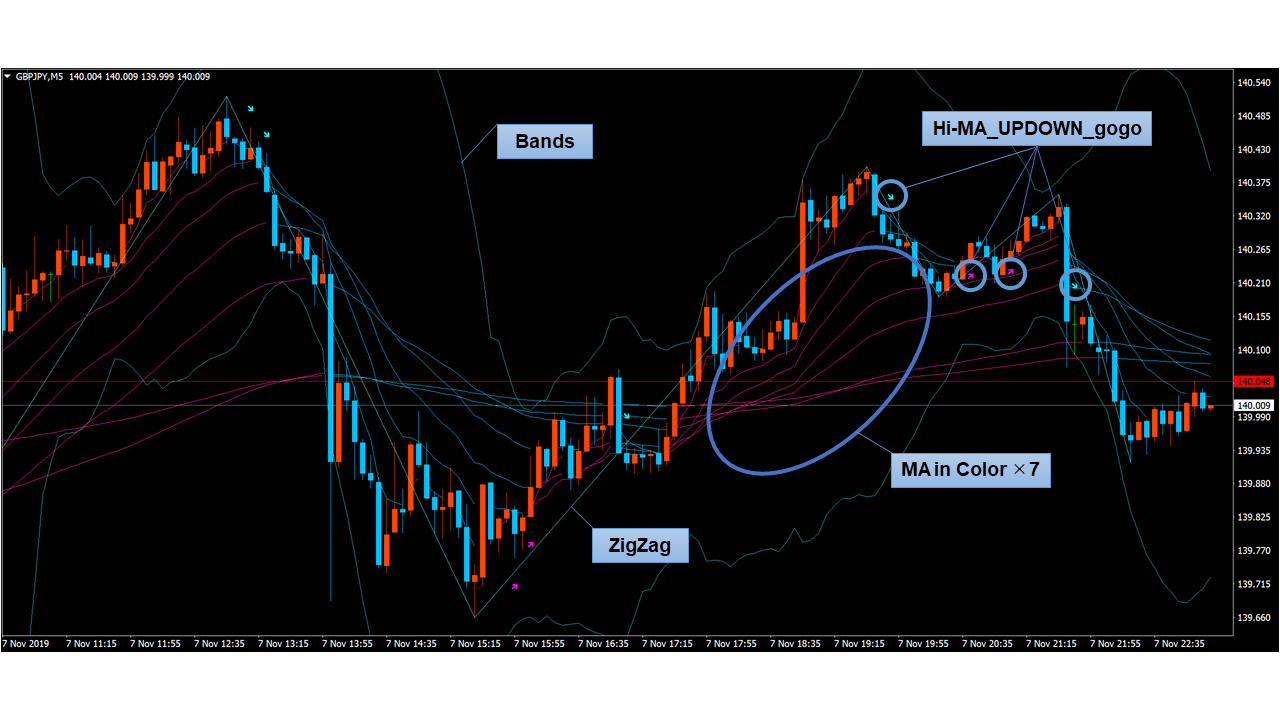
・ZigZag
・Bands
・MA in Color×7
・Hi-MA_UPDOWN_gogo
The seven moving averages seem to reference the Fibonacci sequence.
When rising it turns pink and when falling it turns blue; the visual changes in color and the spacing/convergence between moving averages make trend strength and reversals easy to see.
You can also recognize moving average trend reversals from the arrow signals, so you can judge at a glance. Beginners should use this as a reference to reduce hesitation.
2. Sub-chart
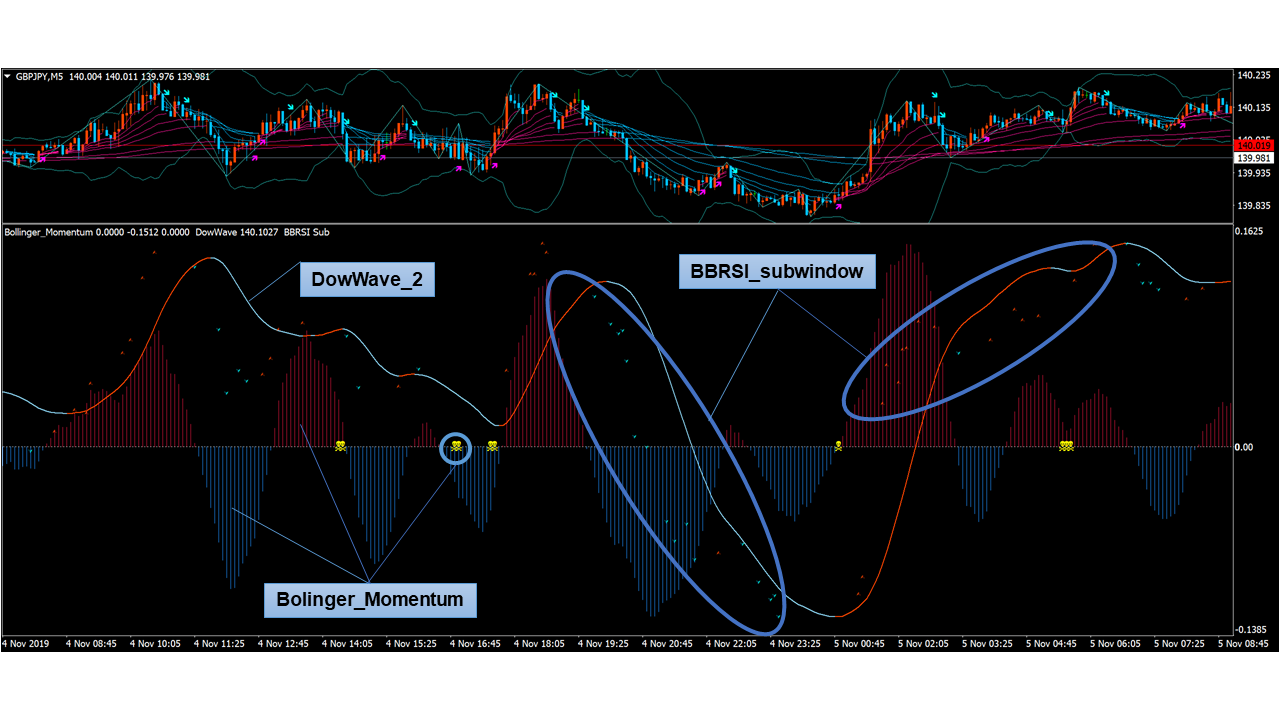
・Bolinger_Momentum
・DowWave_2
・BBRSI_subwindow
Displays Bollinger Band squeeze and expansion as a histogram.
Above the 0 line, a yellow skull mark signals a low-movement range market—be cautious with trades.
The triangular points of BBRSI correspond to up/down trend clusters (core is RSI, two other oscillators are combined, points appear at certain values when conditions are met)
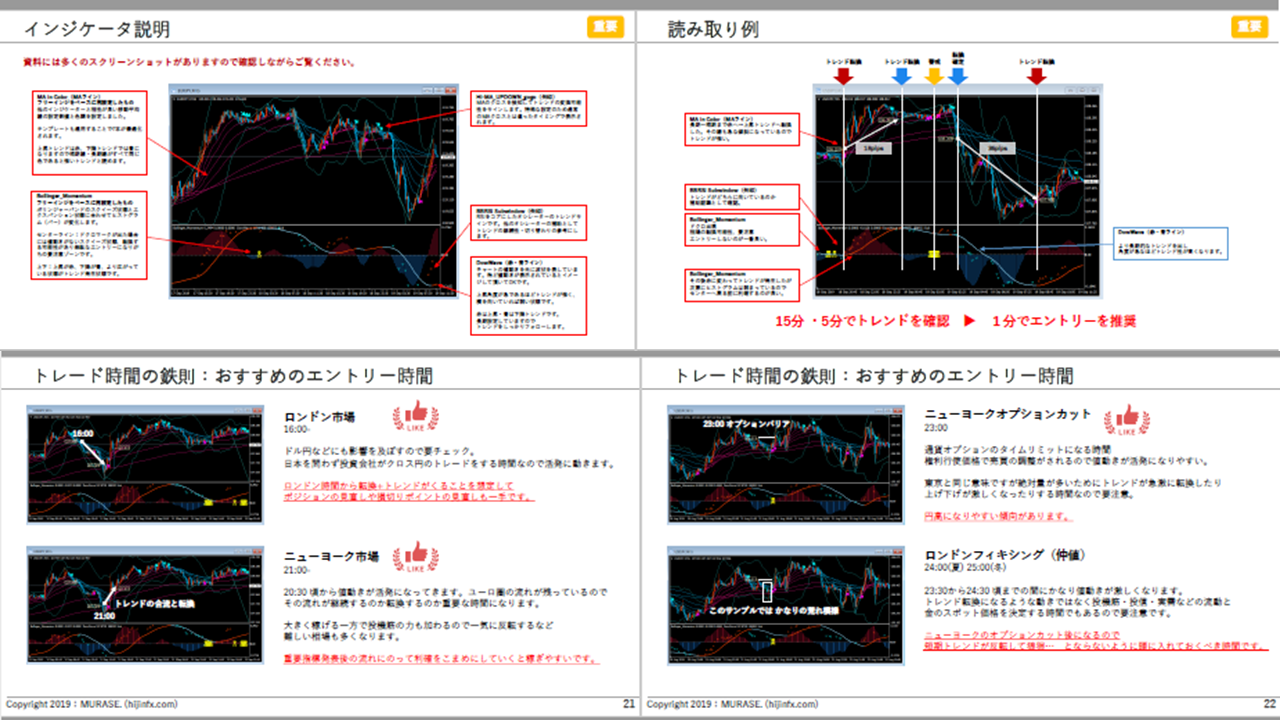
【Points to use the indicator】
Check whether the trend is rising (pink) or falling (blue), how much the trend judgments of each indicator agree, and pay attention to the line angles to judge whether the trend has momentum for entry/exit.
Timing Example 1: GBP/JPY 5-minute chart on 2019-11-07
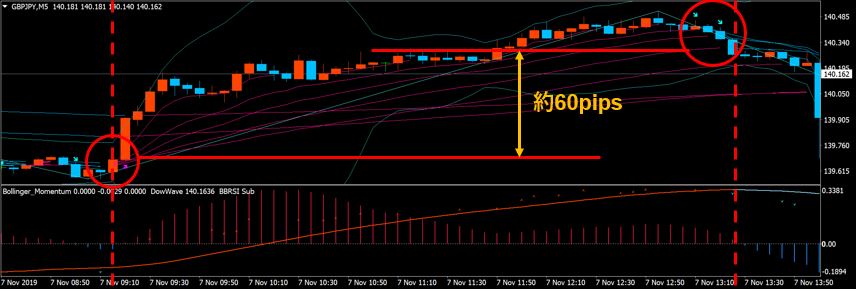
The moving average colors, which were blue, change to pink (rising), and the uptrend signal (arrow) is also visible.
In the sub-chart, the price line turns red, and the histogram crosses above the zero line, changing from blue to red, showing momentum.
All indicators signaled rising (pink) in alignment, so it's a good timing for entry.
Afterwards, as the uptrend continued, if you exit at the moment when the moving average color, trend signals, sub-chart line color and histogram turn, you could gain about 60 pips.60pipsof profit could be earned.
Timing Example 2: GBP/JPY 5-minute chart on 2019-11-06
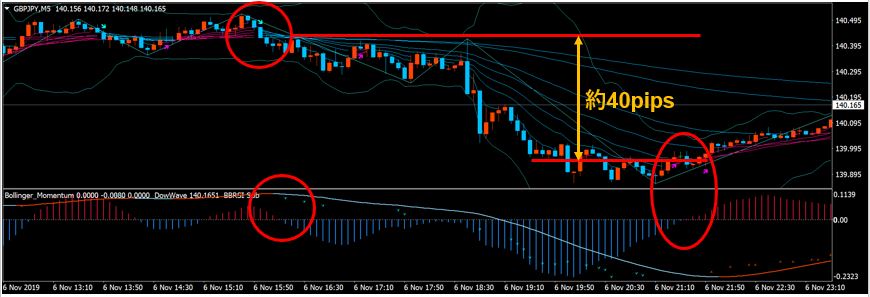
This entry aimed at a reversal to a downward phase. Like the previous timing, enter short when the moving average color, trend arrows, sub-chart lines, and histogram align.
Then, by exiting when each indicator reverses, you couldabout 40pipsof profit was earned.
【Entry logic using the indicator and the FX Tiger's Guide】
This indicator is a great tool, but simply having the tool does not guarantee immediate wins.
In addition to usage explanations and explanations of the entry logic using this indicator, a PDF document explaining MURASE's approach to trading—from the basics of FX—is attached.
You can also study the PDF contents through videos. The videos are divided into six parts, and you can study only the topics you want.
Beyond the convenience of the indicator, you can learn the knowledge and mindset needed for trading in an easy-to-understand way, and the product is packed with approaches to reproduce the methods of high-win-rate traders.
Currently for a limited time35% off special priceis available, recommended!
Please also check the recommended points of the indicator as explained by the presenter!
【Related videos】