Shou Jingi's Upwardism ~ Which stocks is he monitoring? ~
Hello everyone. This is Akiko Shou Shou, owner of Kirameki Chartist.
The city has become a season where Christmas illuminations look beautiful, doesn't it?
Everyone, have your Christmas plans been decided?
Among frequently asked questions, there was one about “which stocks do you choose?” so I’d like to introduce it using Kirameki Charts.
Basically, I value the chart patterns.
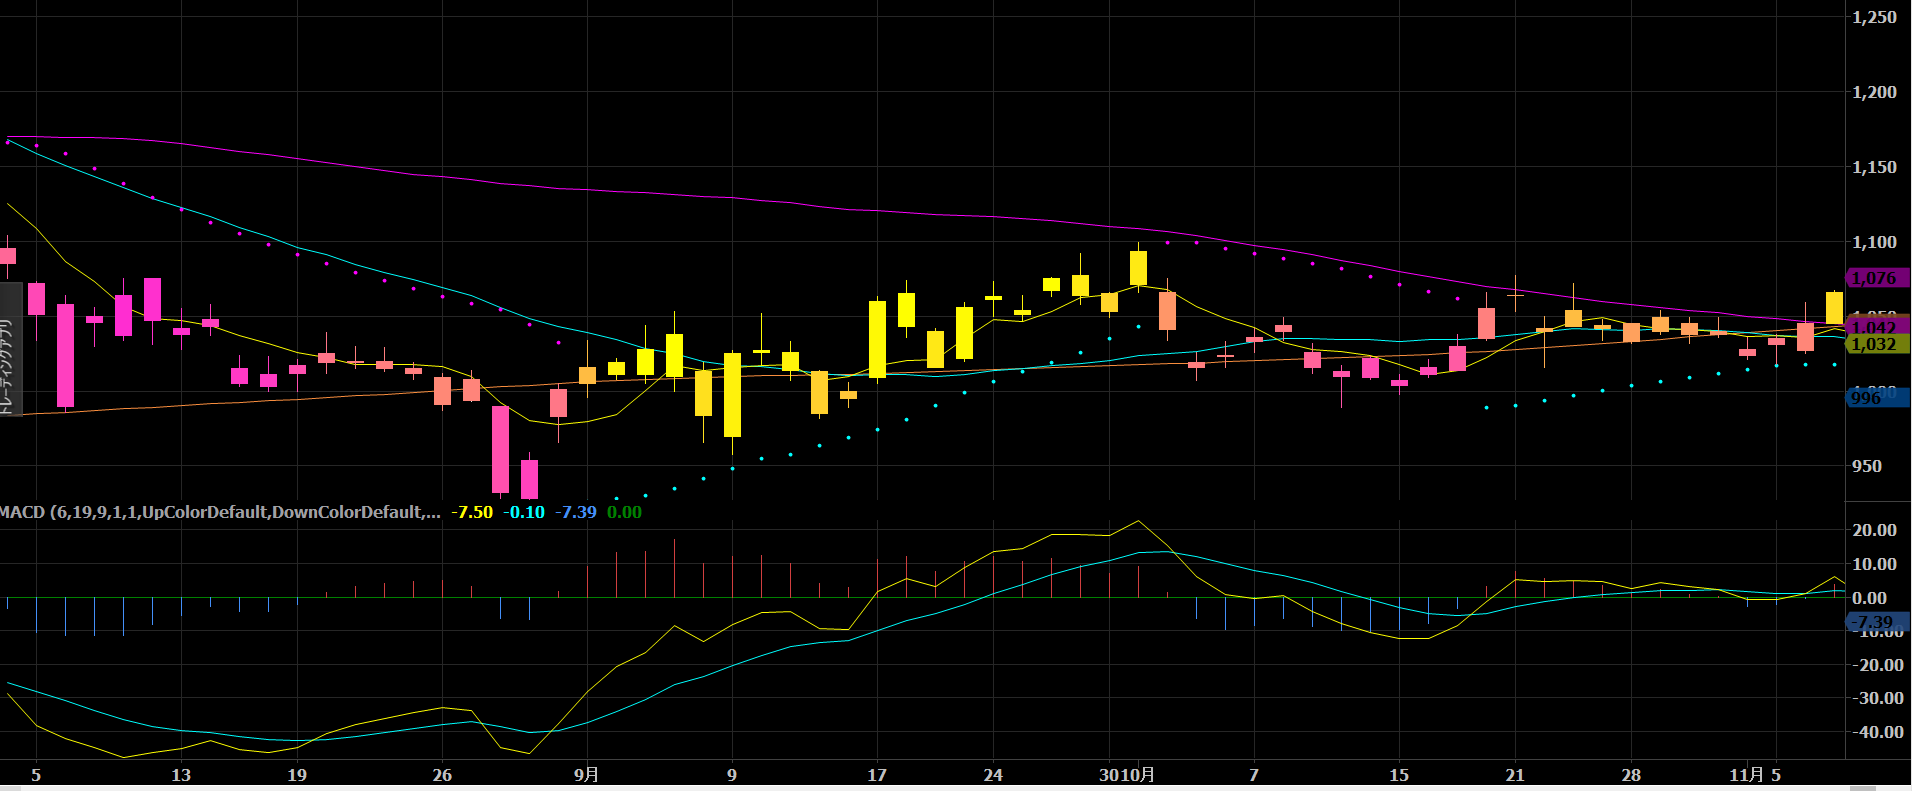
For example, this chart
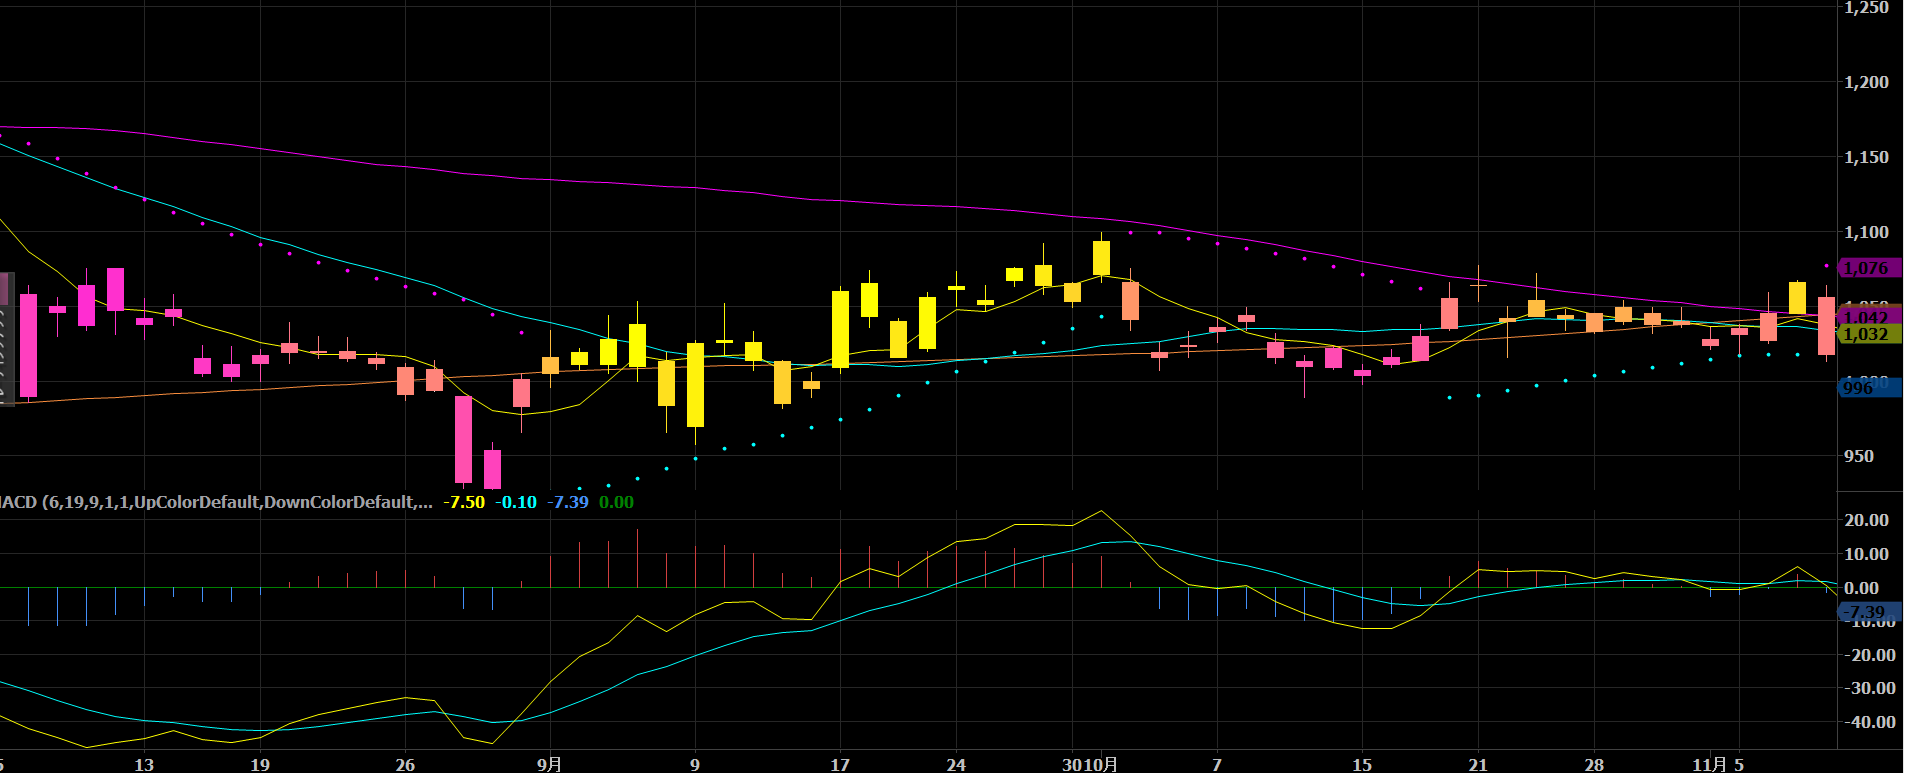
I also monitor charts like this.
Why?
First,
1. How is the MACD?
2. How is the stock price?
3. How are the moving averages?
Let’s look at these three points!!
Regarding MACD, it is crossing the zero line and moving up and down horizontally, isn’t it?
Regarding the stock price, it is in a sideways BOX.
And the moving averages, both short-term, mid-term, and long-term, all converge.
This is the key
After the moving averages converge, they have a tendency to break away in one direction.
Watch closely !!
The next day, a large bearish candle broke below all moving averages.
Then, the gradient also changed from yellow to orange,
and MACD also broke below zero,
and the histogram turned blue.
The Parabolic indicator also showed a downward signal with the pink dot lighting up.
At this point, you can already tell which direction it will release to, right?
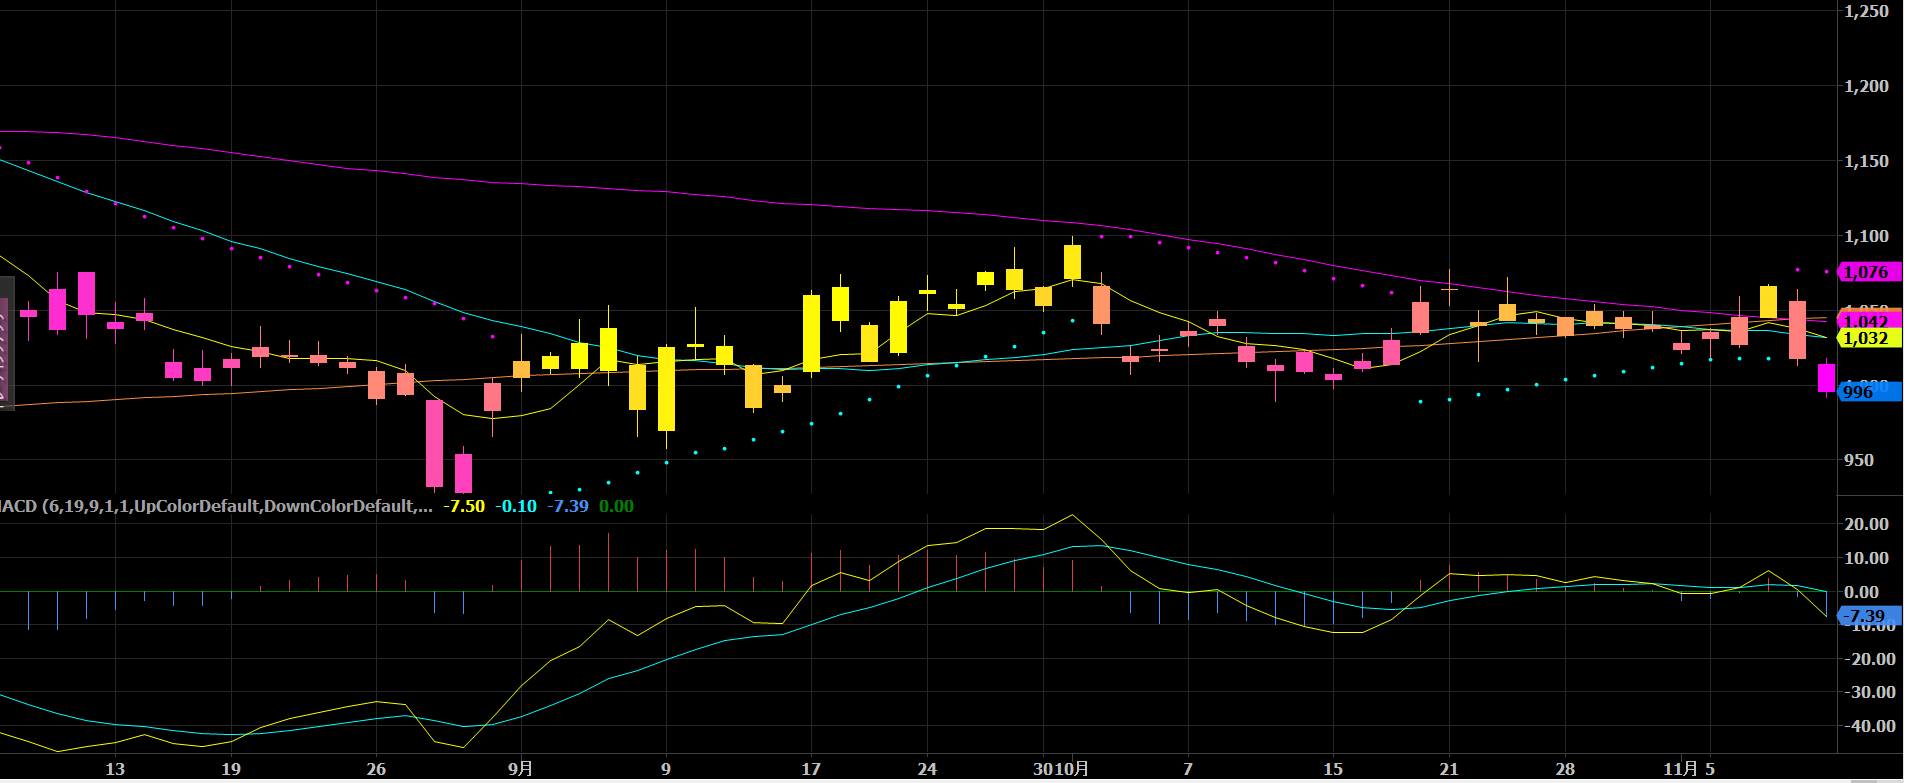
As expected, the gradient fell with pink.
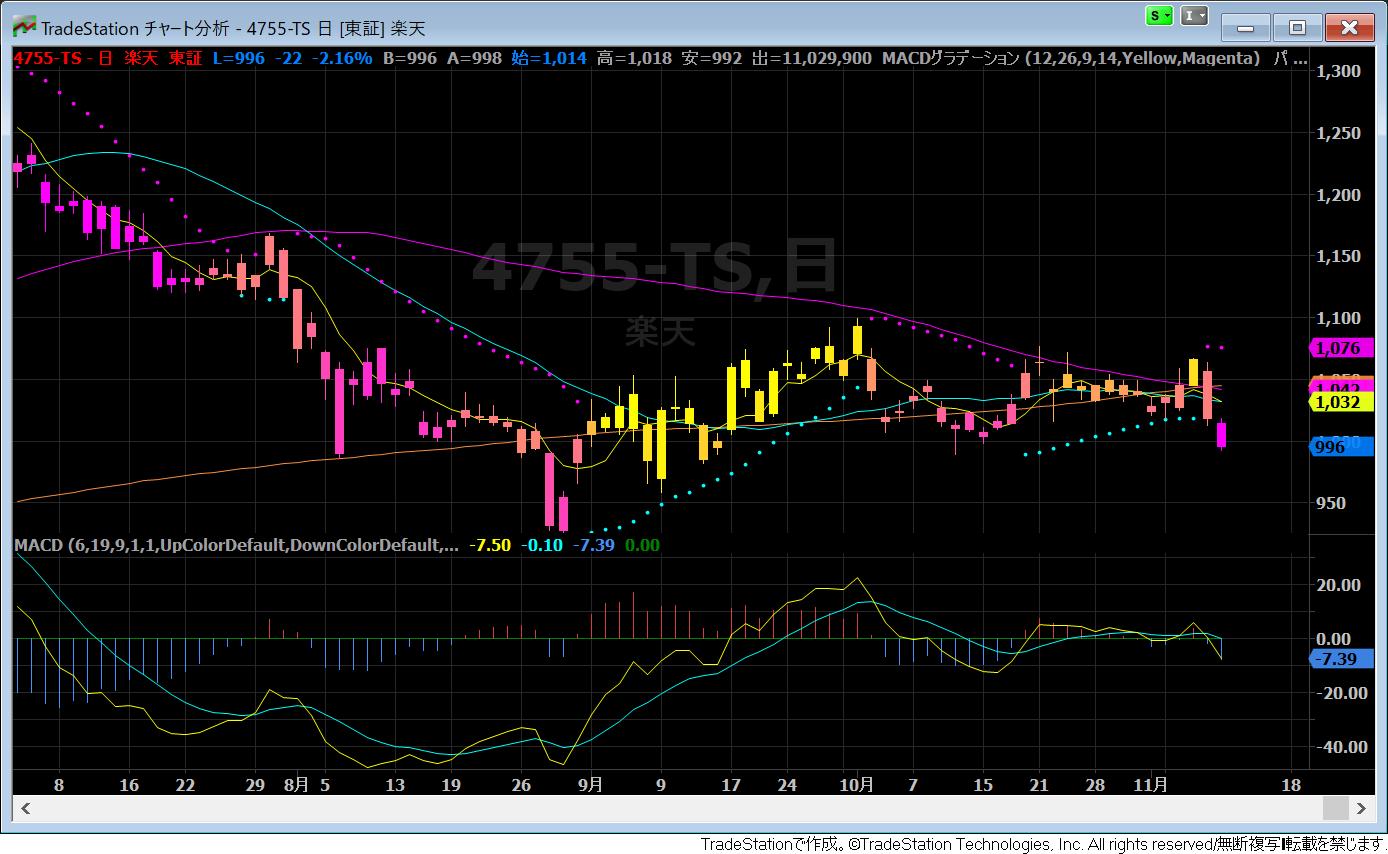
I think you can see how even such stocks can be monitored by watching the chart.
By the way, this stock is
4755 Rakuten
The daily chart period is from August 5 to November 11.
For reference, I’ve summarized the definition of monitored stocks.
I also publish daily trades on my blog.
Blog is here → https://ameblo.jp/bikabubikabu/