How to address common pitfalls in the RCI contrarian method using a moving average filter
The reversal methods using stochastic indicators and RSI to identify “overbought” and “oversold” conditions are probably familiar to everyone.
However, reversal methods using oscillators require the ability to discern range-bound markets, and you won't be able to time entries unless you continue monitoring the oscillator,which is a common concern.such concerns are inevitable.
Among many oscillators, methods that use three RCIs—short-term, mid-term, and long-term—for trend-following and reversal are popular for catching pullbacks and understanding the market state.
From what RCI is, to trading methods using three RCIs, and further methods and tools to improve entry accuracy, I would like to introduce them.
- About RCI
- (Rank Correlation Index) = rank correlation index.
- It focuses on the correlation between price and time by ranking the magnitude of price, to gauge the momentum of the market trend and overheating.
RCI = (1 - (6 × d) ÷ (n^3 - n)) × 100
- d: the squared difference between the date rank and the price rank, summed up
n: period
Date rank: as of today (latest date) = 1, counting back: 2, 3, 4...
Price rank: the highest price in the period = 1, then 2, 3, 4 in descending order
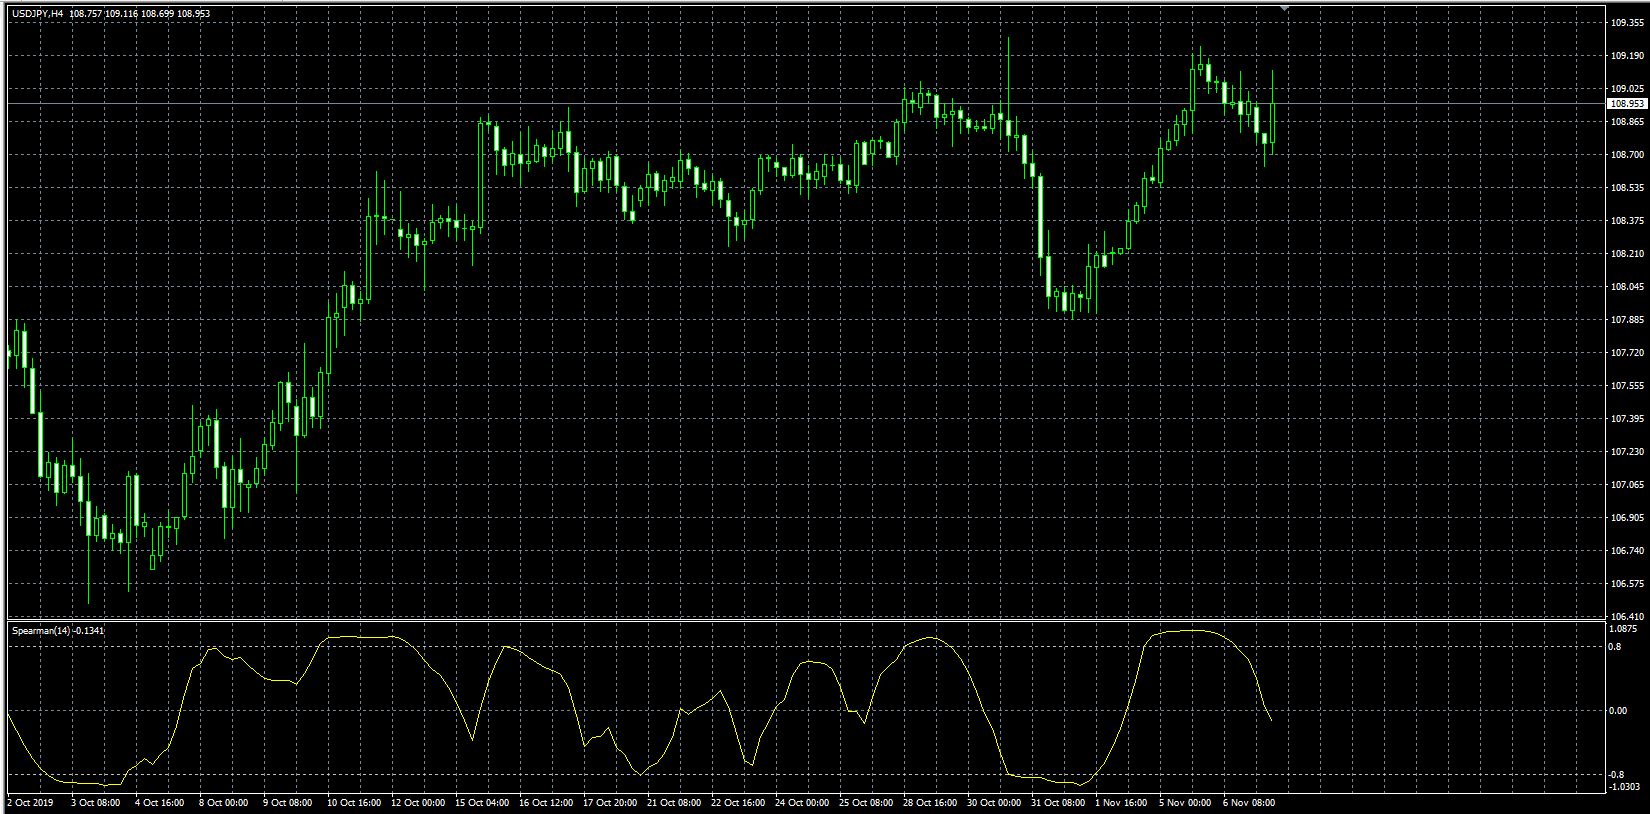
▲ Display of the default RCI (period 14) on a 4-hour chart.
In the early stage of a trend, rising above 0% is consistent; and a reversal from -0.8 (-80%) also shows the chart rising again.
Trading Rules for a Single RCI
Trend-following: When the RCI crosses above 0% into positive territory, it indicates a “buy market”; conversely, it indicates a “sell market”
Range-market reversal: In range markets, when mid-term and long-term RCIs hover within the 80% range, reverse on a rebound from the short-term RCI by more than ±80%
RCI Method Displaying Three RCIs
We overlay and display the three RCIs—short-term, mid-term, and long-term.
Each parameter is set to 9, 26, 52.Short-term 9 is for entries; mid-term 26 for trend determination; long-term 52 for confirming market direction.
1) Case of trend-following in a trending market
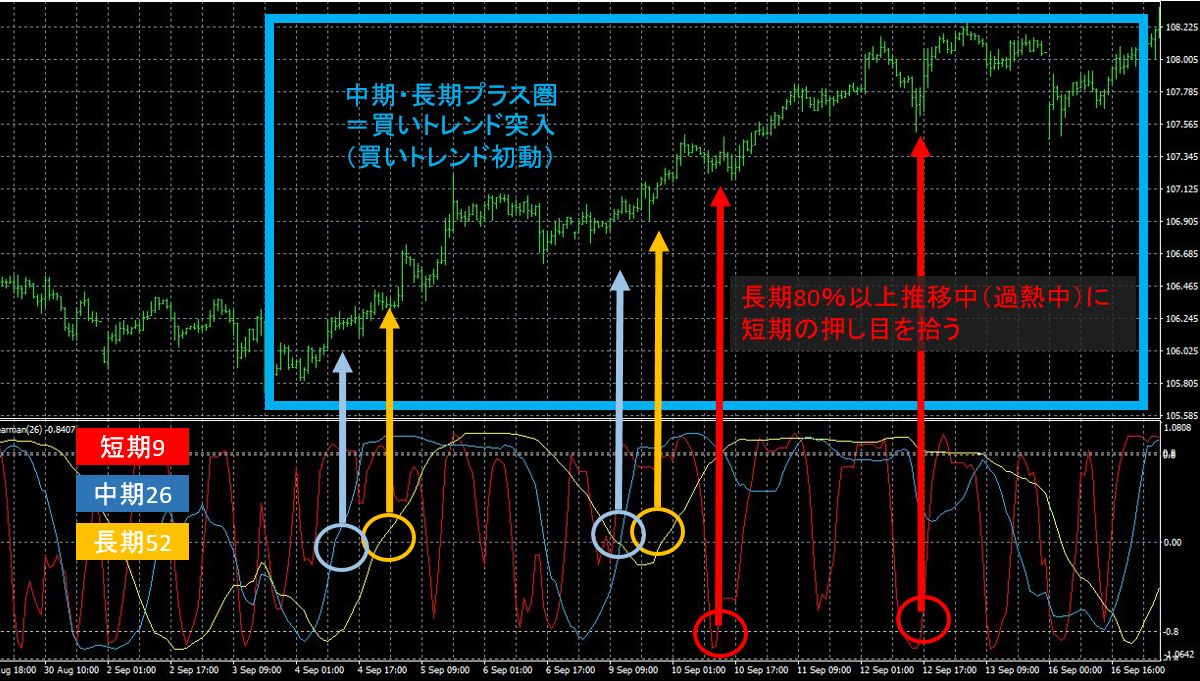
First, the mid-term and long-term RCIs rebound from around -80% and cross above 0%, entering the positive zone (bullish market).
Next, the mid-term falls toward roughly -80%, but the long-term again rises near 0%, moving back into the positive zone.
A long-term RCI staying above +80% indicates a strong uptrend, so during that period you would look to enter on a pullback when the short-term RCI reverses from -80% (pullback).
2) Case of reversal in range markets
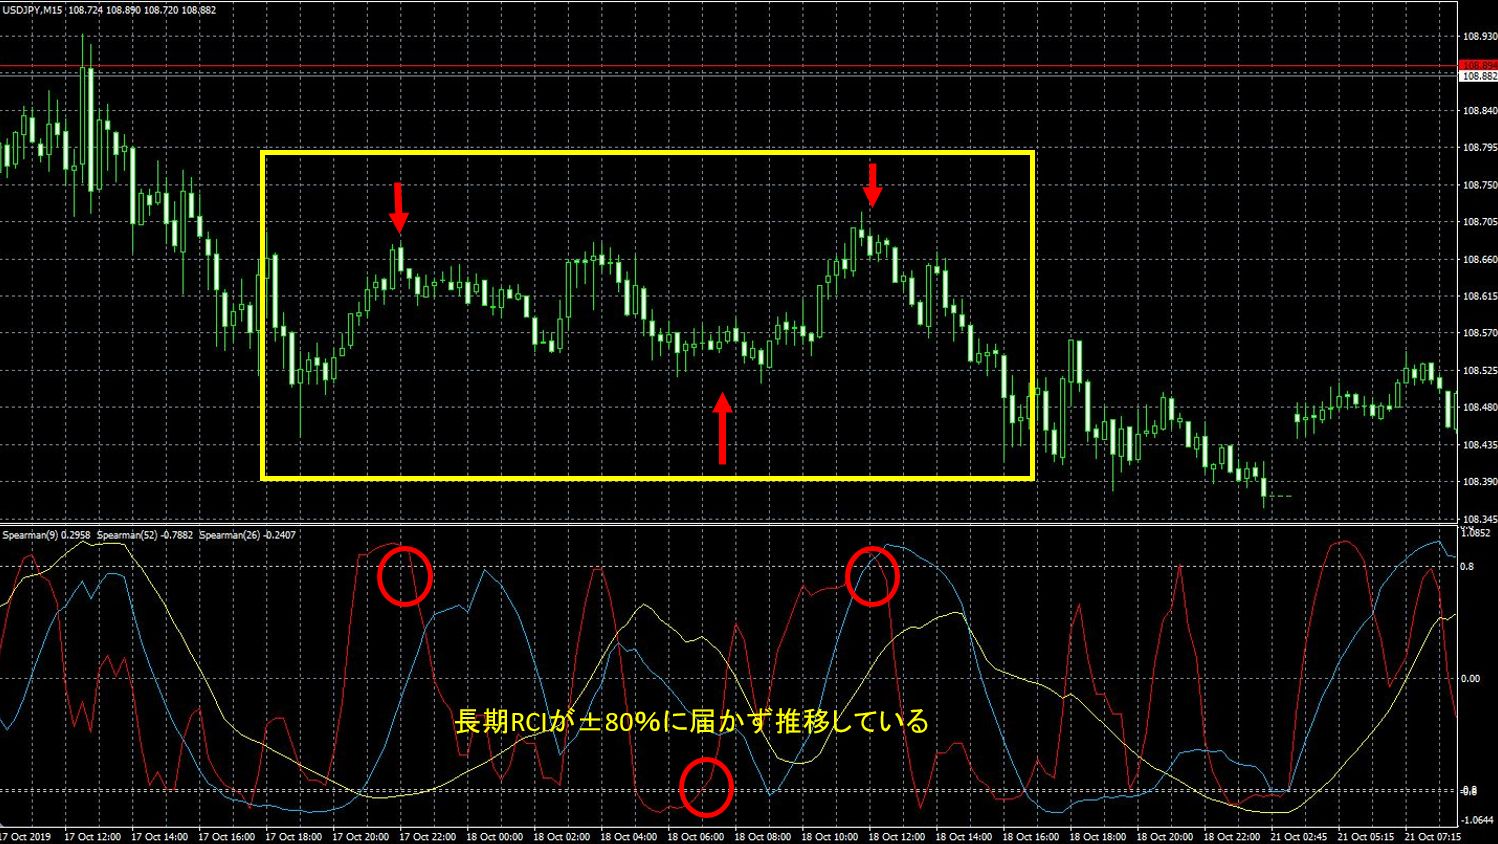
In a range-markets, it is common for the long-term RCI not to reach ±80%. In such cases, you would look for a reversal timing from the short-term RCI within the ±80% range and enter.
In range-market trading, you perform a do-ten trade, buying, closing the position (selling), and at the same time placing a sell order and a buy exit, repeatedly.
This makes it appear to be a very powerful indicator that you would like to adopt quickly, but you will notice issues as you use it.
Problems of RCI
• Clear trend continuation cannot be determined even with long-term RCI
• Trend reversals are hard to identify; depending on the timeframe, the RCI indicator may not be reliable.
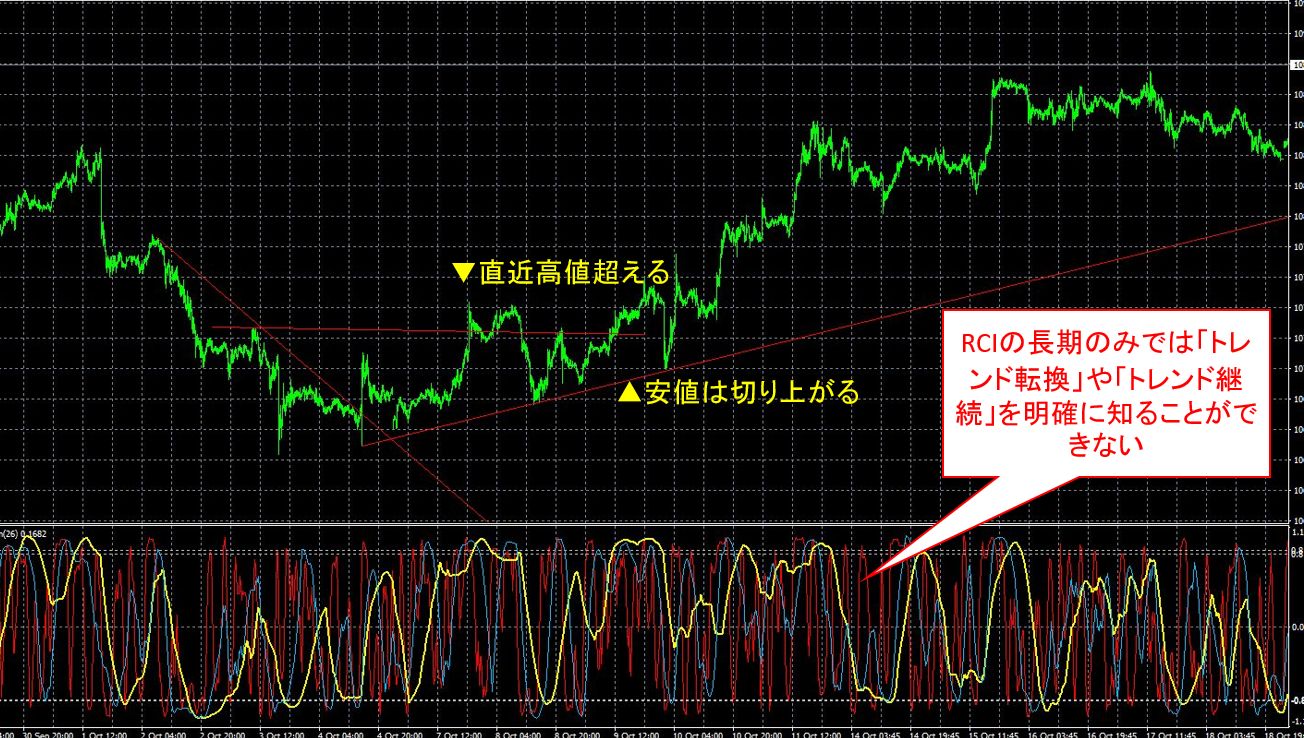
As shown above, even as price shifts from a downtrend to an uptrend and follows the trend rule of “surpass recent highs, raise lows, make new highs,” the long-term RCI continues to rise and fall around ±80%. In such cases, a method like “timing entries with the short-term RCI aligned with the direction of the long-term RCI” cannot be used.
Also, not knowing trend continuation means you also can't know trend reversals.
Without Dow Theory-based knowledge of clear trend reversals, you can be tossed about by the ups and downs of the long-term RCI.
Let's use MTF Moving Averages as a Trend Filter!
Therefore, instead of relying on RCI alone, display multi-timeframe moving averages to clearly filter the trend direction.
Multi-timeframe moving averages is a method of displaying multiple moving average lines from short to long term on several charts so that the directions of the short, mid, and long term are clearly visible. When displaying many moving averages, it's also called a Rainbow Chart.
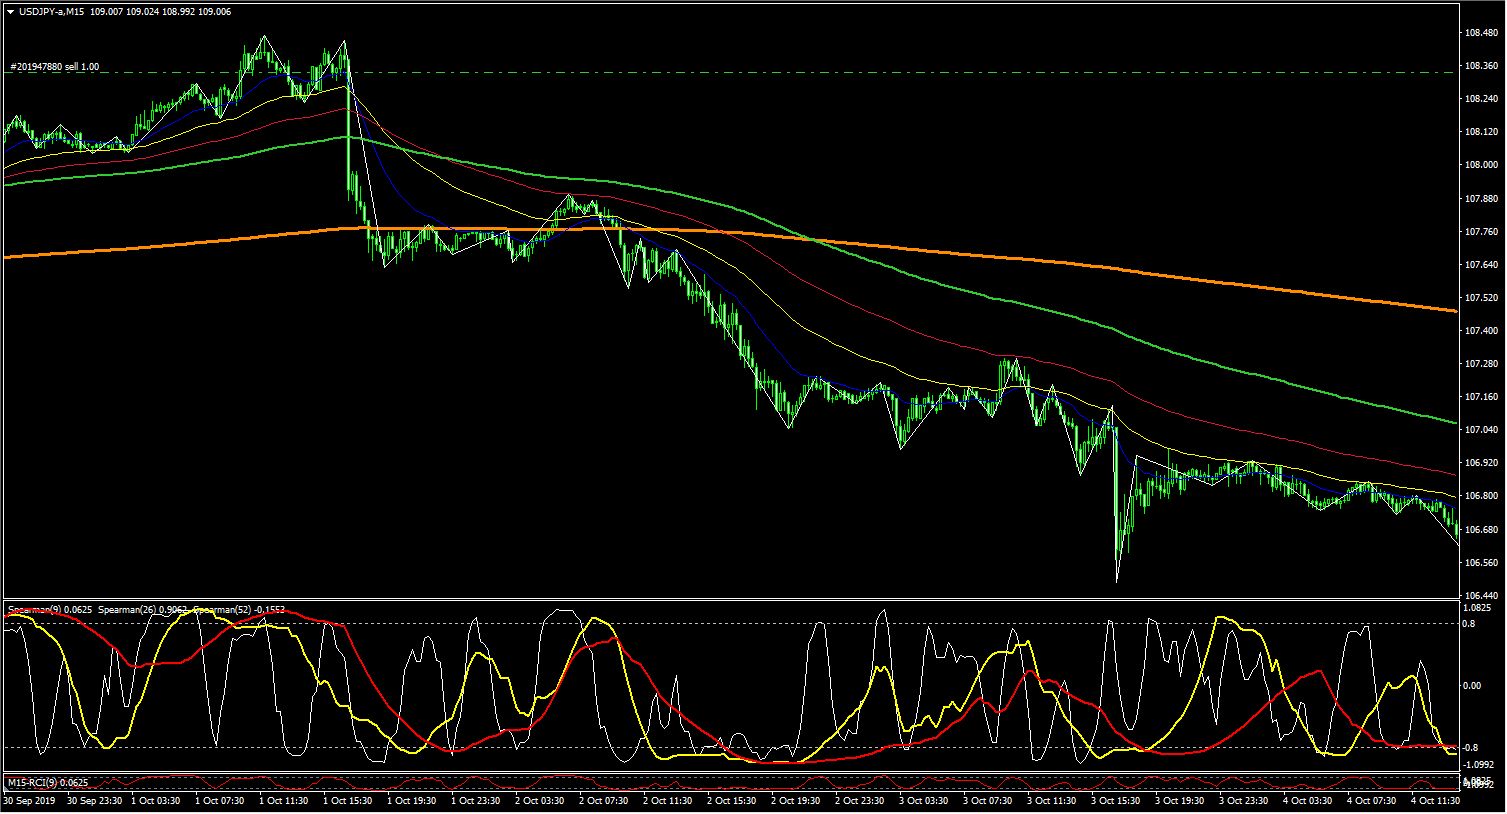
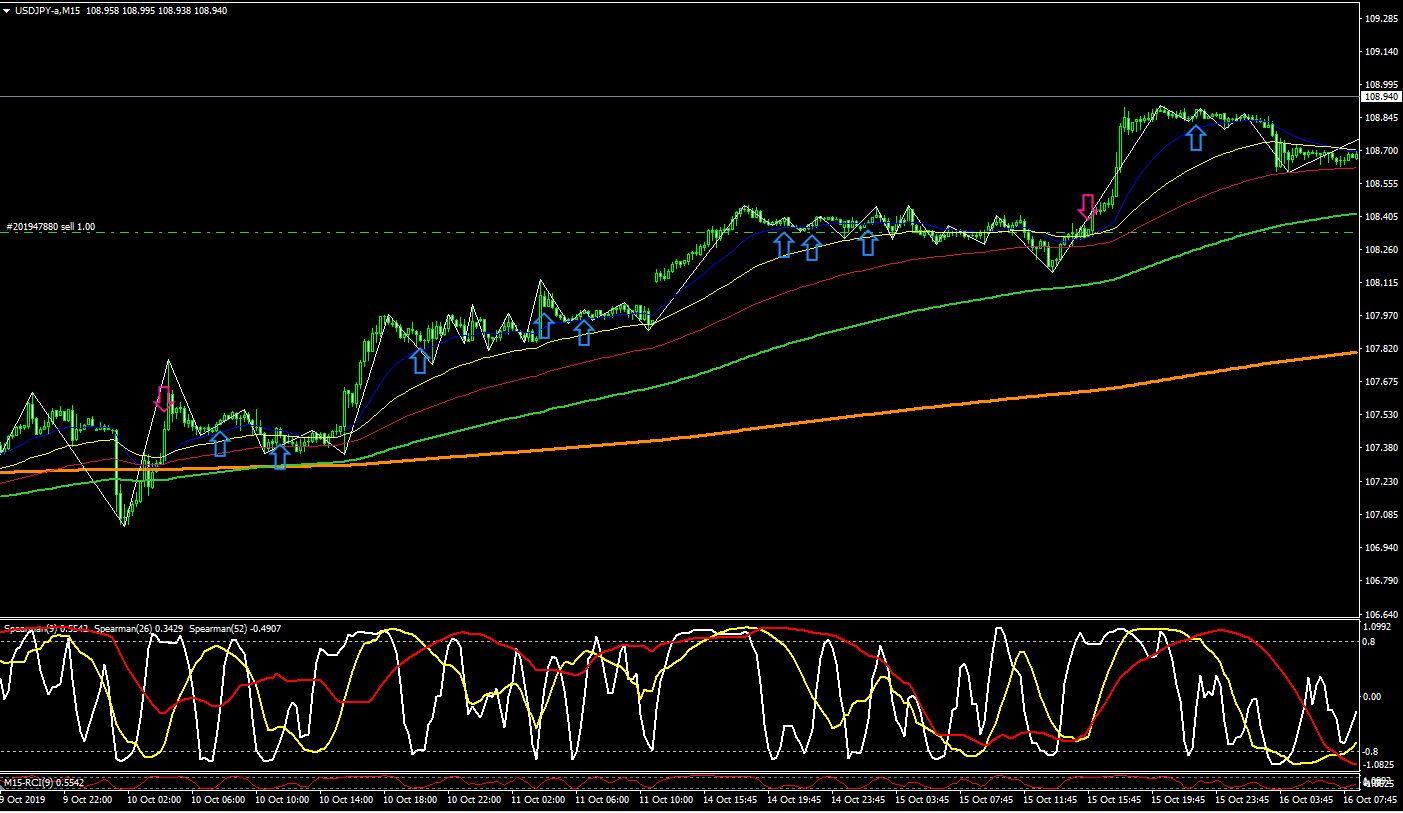
With the MTF moving averages, the direction is easier to see. The orange moving average line represents 800 bars and serves as a major signal for a big trend reversal.
When the price is below the moving averages, the downtrend is continuing, so now the mid-term and long-term RCIs can be used for entry timing as well.
Display entry timing by RCI on the chart as signals!
Now that trend reversals and continuations can be identified with MTF moving averages, to further facilitate trading, wouldn’t you like to stop visually inspecting RCI pullbacks with your own eyes?
Wouldn't it be great if you could be notified by signals, alerts, or email whenever any chosen RCI returns from above ±80% back within ±80%?
That is realized with this!
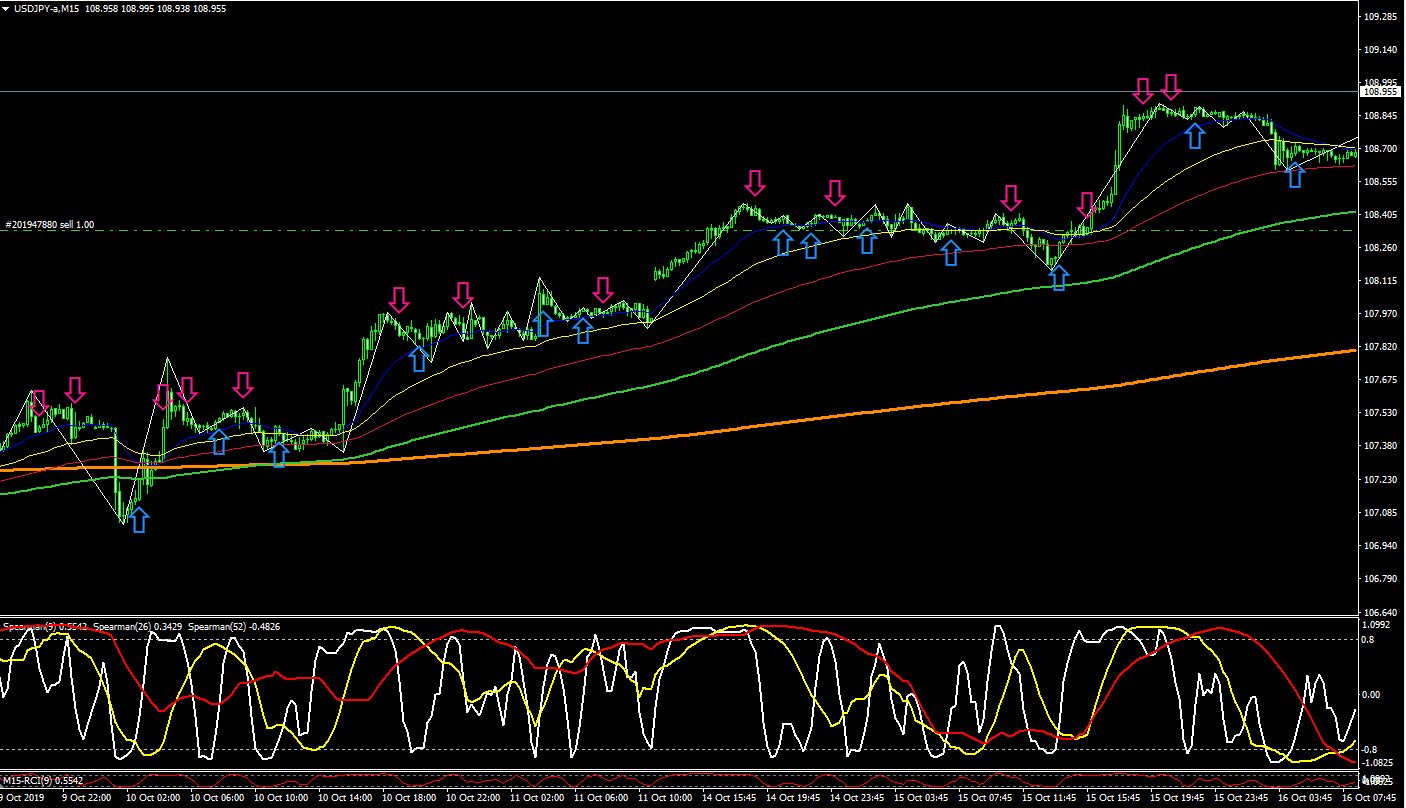
I’ve displayed on the chart a sign for the rebound from the short-term RCI (9) back from ±80% as a signal.
Hmm, but this would also show selling timing in an uptrend, so if you trust the signals as they are you might get burned…?
Of course, if you apply a moving-average filter yourself, there’s no problem, but when you’re away from the market, email alerts for contrarian timing become a nuisance.
In a trending market, this tool only issues signals in the direction of the trend! This is the kind of solution that addresses that need.
When the price is above a chosen moving average and a reversal signal from the short-term RCI occurs, a buy signal is displayed only then—this is the "Moving Average Filter".
If you’ve read the explanations of past RCI methods, this is probably a surprising tool, right? You no longer need to watch RCI movements with your eyes! And you can pick only signals in the direction of the trend!
MA Filter + RCI Reversal Signals = “RCI Perfect”
A signaling tool that seems poised to solve all the problems of the RCI reversal method... that is the signaling tool introduced earlier, “RCI Perfect.”
Features of ‘RCI Perfect’
① Choose the RCI level line to alert
② Choose alert type — signals for “overbought only”, “oversold only”, or both
③ Choose alert timing — options include “outer to inner only”, “inner to outer only”, or both
④ MA filter on/off (also choose the MA type)
⑤ Email/alert function
⑥ Arrow on/off option
Since there are many parameters you can adjust, you have a high degree of freedom and can customize it for various trading styles.
Most importantly, as described above, you can display only the short-term RCI reversal points you want to catch, understanding RCI’s characteristics and drawbacks.
The biggest strength is that you can understand your own entry logic and trade accordingly.
For example, in a market where a sharp drop is followed by a deep rebound, the usual moving average filter (MA50) does not produce an RCI9 reversal signal.
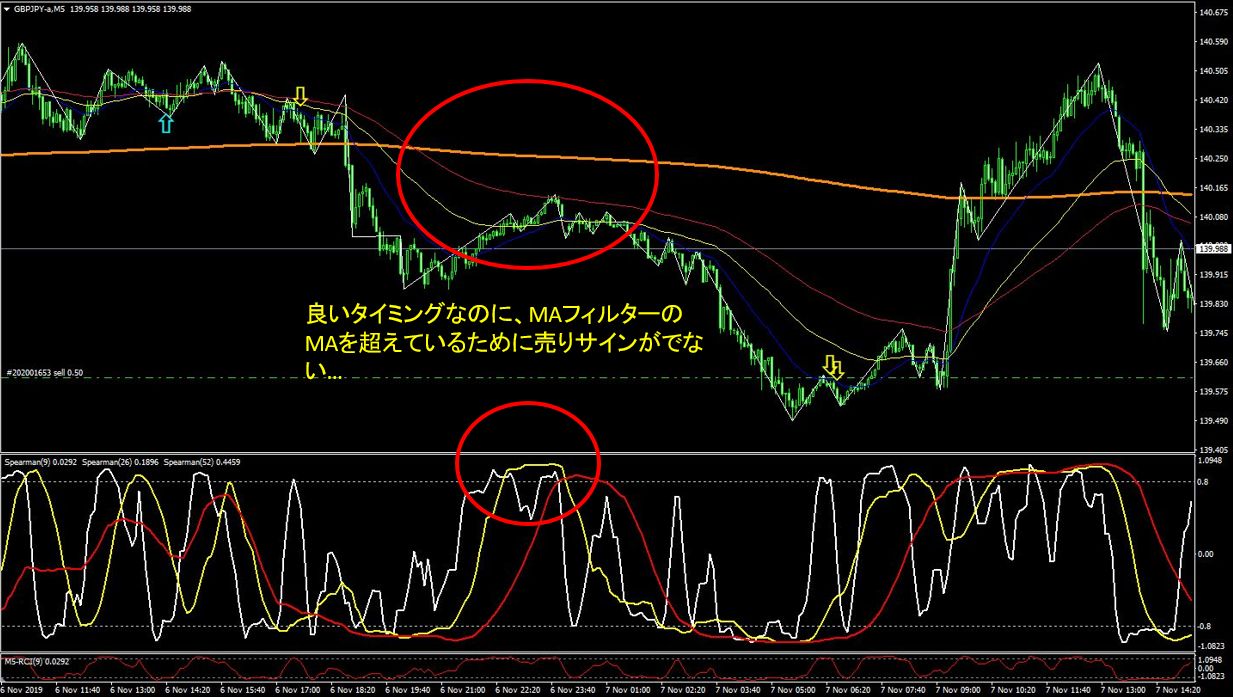
However, if you understand the logic of the signal, you can see that the reason for the RCI9 reversal timing is simply that the price is above MA50.
Depending on the situation, try changing the MA filter to 100.
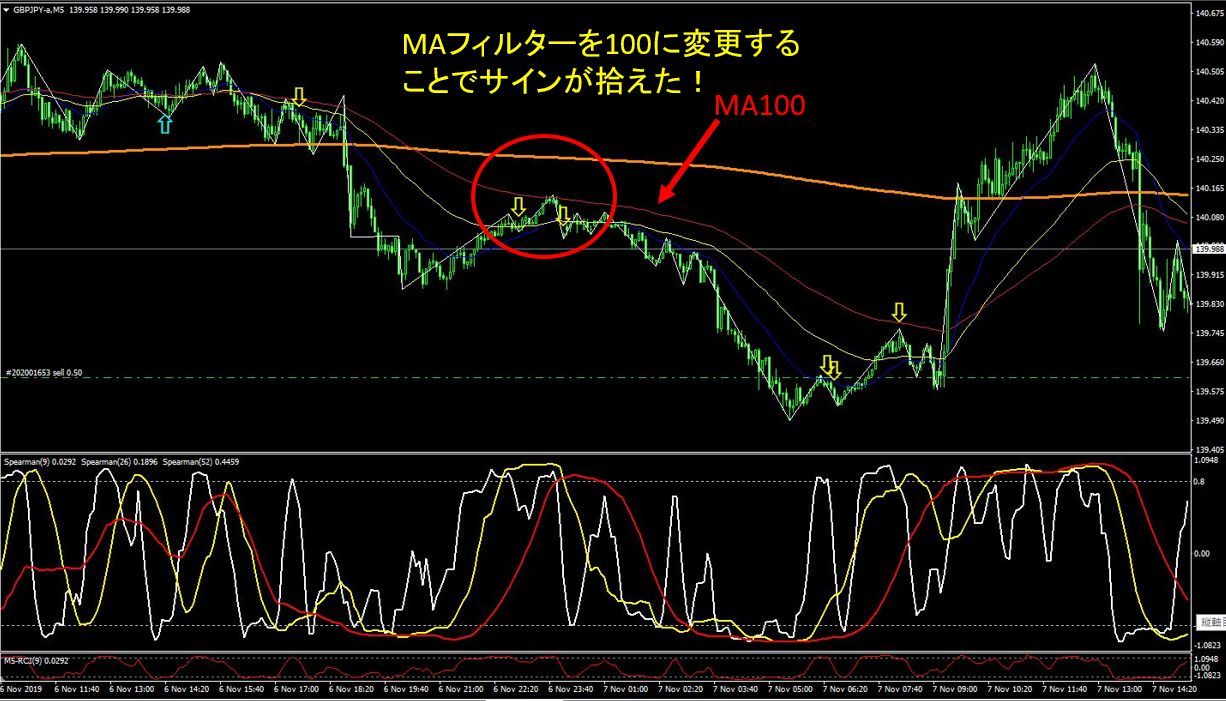
Don’t you think you’re catching good pullback timing?
Rather than blindly trusting the direction of arrow signals, understand why the signal appeared there, and adjusting yourself makes it possible to find entry points better suited to the market—this is “RCI Perfect.”
Also, “RCI Perfect” isn’t just an indicator; it comes with a rich Web manual, so you won’t be lost on installation or signal extraction. It also includes strategy guides:
・【Method A】 RCI Trend Following Trade
・【Method B】 RCI Reversal Trade aiming at the tops and bottoms of trends
are explained.
In particular, Method B, being a reversal from the tops and bottoms, is a trading method with high profit potential.


written by Tera GogoJungle Marketing.