

[11/1] Reached an astounding 423.6%! A USD/JPY trade example
Hello! I’m Sakkiy, a wave trader (@skiym_aaa).
I left the company I joined as a new graduate after three years and am now a full-time trader.
My trading style is day trading,
and every day I aim for the third wave of the Elliott Wave.
Now, let's quickly look at the Elliott Wave that occurred yesterday (10/31)!
★ USD/JPY 1-minute chart in the evening (around 17:34)25.0pips gained!
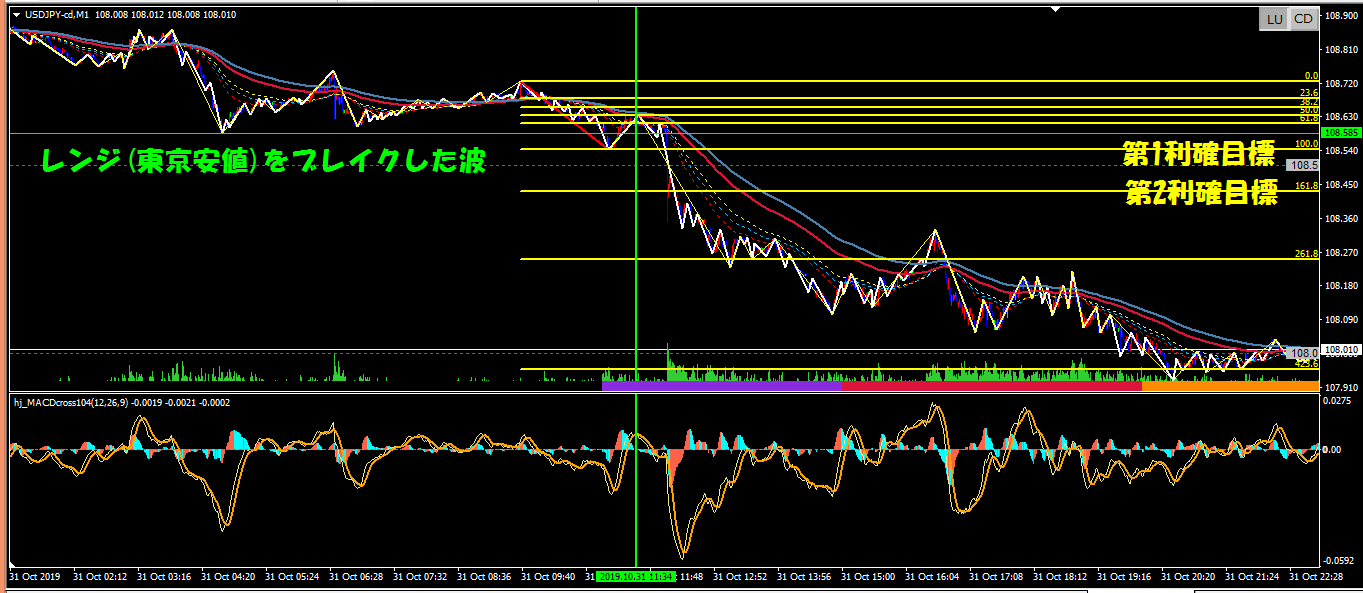
※ Fibonacci retracements are drawn from the end of Wave 1 to the starting point.
- Entry rationale (Wave 1 recognition basis) ➜ the wave that breaks the range
- Entry ➜ 61.8% retracement by Fibonacci, then MACD dead cross
- Profit target ➜ 100% of Fibonacci (6.9 pips), 161.8% of Fibonacci (18.1 pips)
- Stop loss ➜ 23.6% Fibonacci
- Point ➜ broke Tokyo’s low. Reached 423.6%.
We captured Wave 1 by breaking the range around the evening (Tokyo time low).
The price range reached as much as 423.6%.
As you can see, it’s common for the range to extend beyond 161.8% to 261.8% and reach 423.6%.
Well then, see you tomorrow!
【Blog】
↓ I disclose my own trading results and the “Wave Trading” method explained here!
“How to Start Being a NEET at 25”
【Twitter】
↓ I tweet blog updates and real-time Elliott Wave examples!