Jo Shirokyo's Rise Ideology ~ The Spark Chart Can Be Used Beyond Day Trading!! ~
Hello everyone. I am Kirameki Chartist Akiko Shou.
The Nikkei average is struggling to rise, isn't it?
The earnings upgrades and strong results from semiconductors and 5G stocks were sold off, right?
Kirameki Chart makes that crystal clear at a glance!!
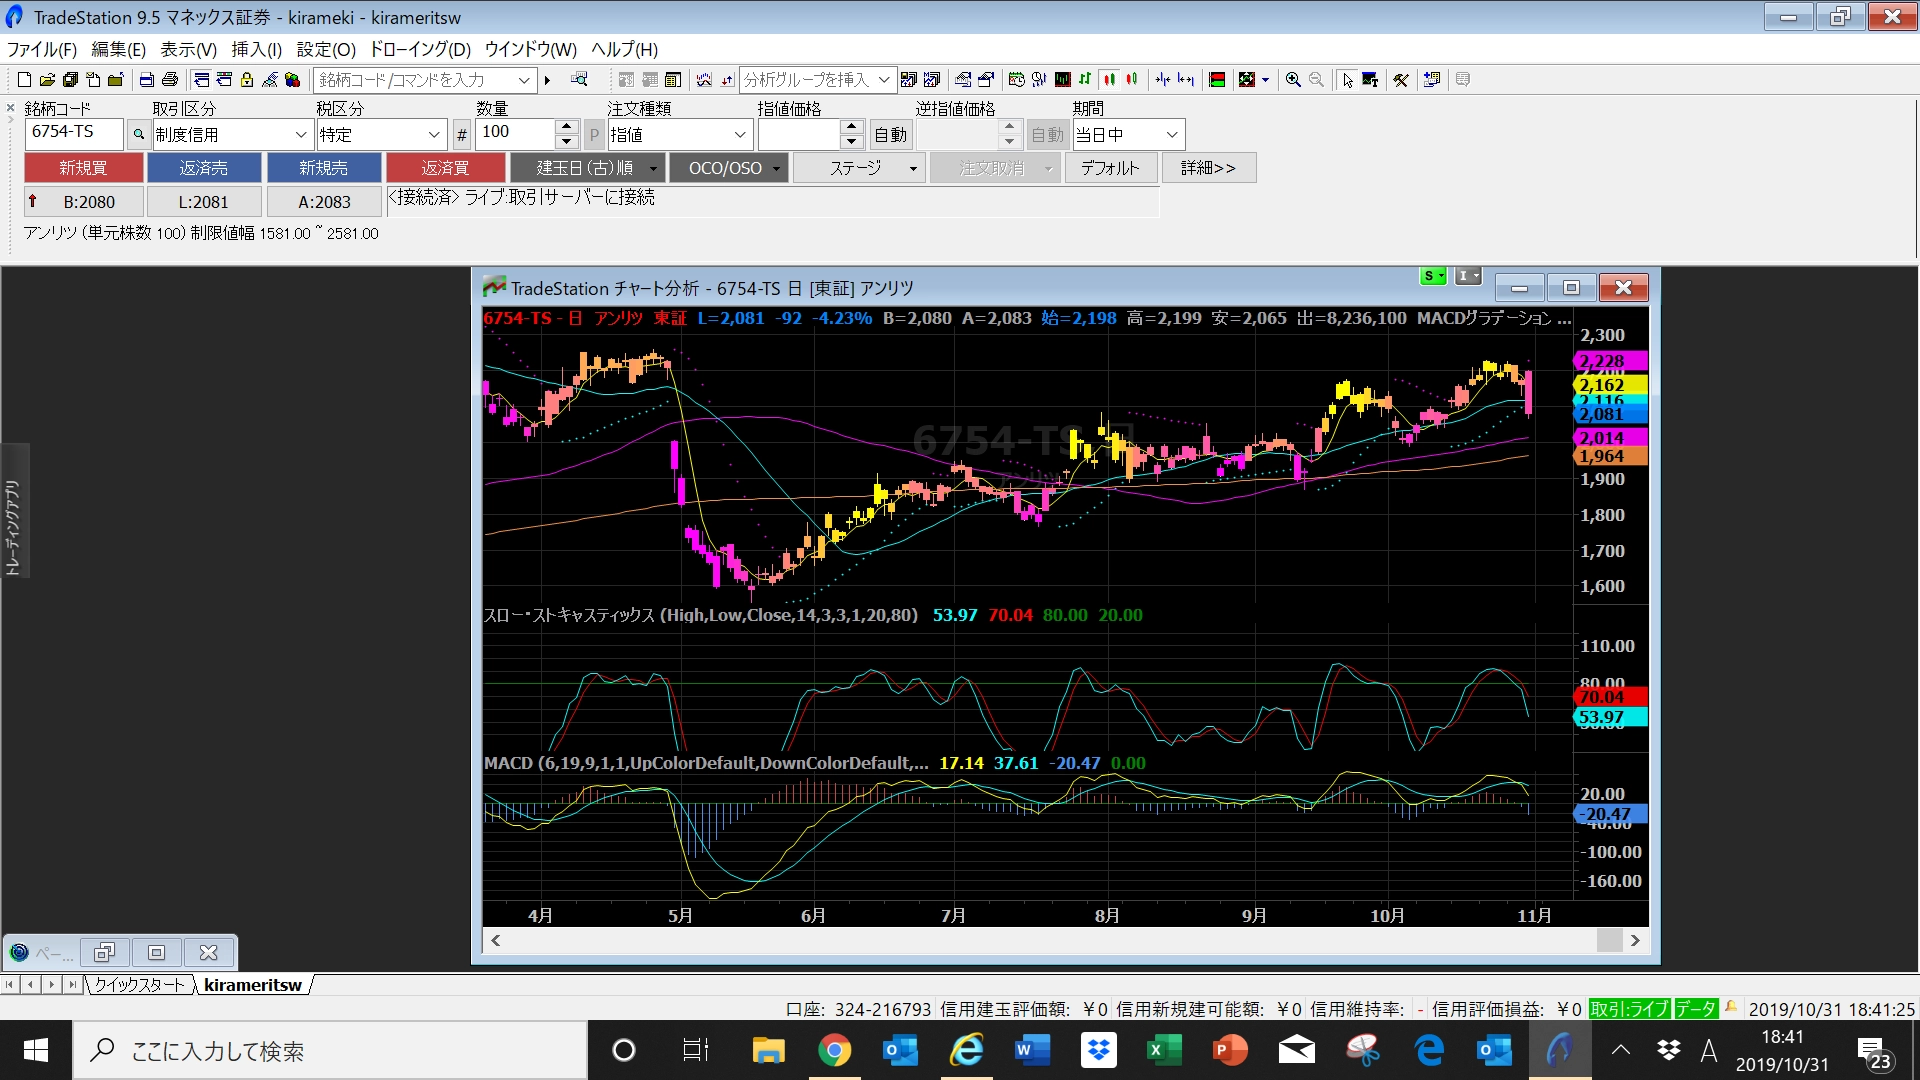
↑ 6754 Horiguchi (Henri-tsu) from April to October 31 daily chart
Since October 29, the gradient colors have been changing, haven't they?
Those who held could have taken profits, I suppose.
Now, enough preface, I will post a video answering your questions.
This time I answered the question, “Can Kirameki Chart be used besides day trading?”
Because I publish daily trades on my blog, I often receive such questions, but to put it simply,
Kirameki Chart can be used beyond day trading.
For those who are working, day trading can be quite difficult, right?
If you engage in day trading, use the 【5-minute chart】
For swing trades, use the 【daily chart】
For mid- to long-term investing, use the 【weekly chart】
If you refer to these, you can use it effectively.
I also talk about entry points in the video.
There is also an explanation of buying opportunities using Kirameki Chart, so please take a look.
I write about daily trades on my blog, so please refer to that as well.
Blog here ↓
https://ameblo.jp/bikabubikabu/