
We will briefly introduce the investment style to be posted on the salon.
The .com bubble burst, the Lehman Shock,
and that 3.11 crash could be predicted in advance too!
Know-how for predicting the Nikkei Average using R-factor
The real reason why optimizing analysis of 225 charts ends up futile
Even if you analyze past 225 charts and discover the chart rules that maximize profits, thereafter
false signals occur frequently, and in the end you don’t make money…
Even valuable trading signalsbecome invalid when there is a lack of conviction.
This is something every chart-focused investor experiences.
So why is that?
The reasons are threefold
First, the 225 is originally a collection of 225 stocks, but additional factors such as the influence of New York stocks and foreign exchange also affect it.
Second, optimizing only 225 with AI yields results that others will obtain as well or similar results,
so the opposing view prevails; in other words, even if past performance was good, real-world results may decline.
Third, there is a lack of an approach that analyzes co-movement indicators with a strong influence on the 225 to prevent false signals and to analyze medium-to-long-term trends (weekly and monthly).
Our company already analyzes market predictions by comparing the 225 and TOPIX charts with at least seven co-movement indicators, including the R-factor. Our results perfectly anticipated the Lehman Shock and the 3.11 crash.
Among those co-movement indicators, the first discovery was this R-factor. So, what is the R-factor?
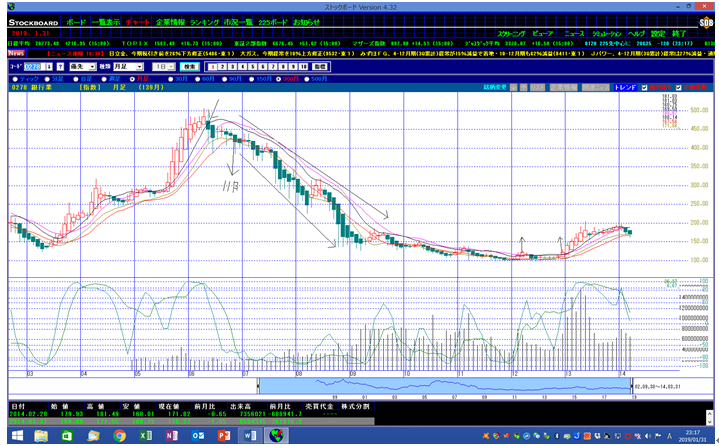
The Tokyo Stock Exchange's demand-supply index; the R-factor is the banking sector
The R-factor is a true mirror of stock market movements.
The R-factor—namely, banks are major shareholders and owners of listed companies.
Because banks also dispatch executives to major corporations, they are most familiar with corporate information.
Also, when banks' core businesses are weak, the real economy weakens. In that case, stock holdings are sold. When stock prices rise, unrealized gains are recognized, lifting bank stock prices.
●The most important point is that banks tend to resist rising even when investor sentiment becomes overheated.
In other words, at market tops, many investors think, “If I don’t buy, I’ll miss out; if I don’t buy now, prices will rise further,” so money flows into theme stocks, but not into banks. As a result, banks tend to fall ahead of the overall market’s top formation.
The bottom formation is an area where banks act as a consensus and confirmation indicator.
The following are examples of forecast accuracy.
Second, past forecasts using monthly and weekly figures
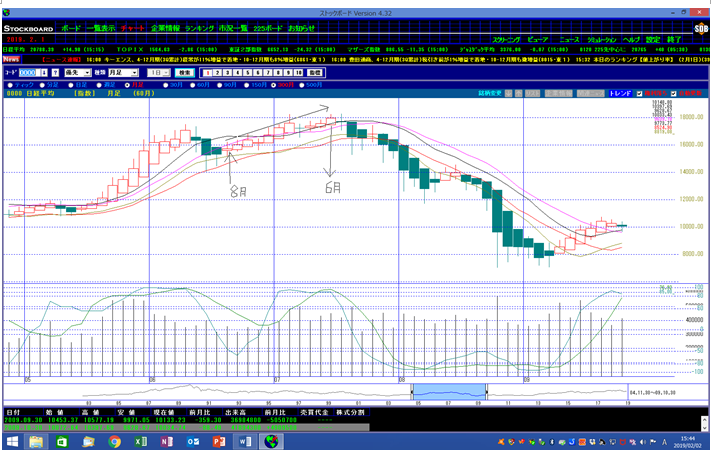
The 2000 dot-com bubble burst was foreshadowed at the end of the previous year
On a monthly basis, comparing the R-factor with the Nikkei Average makes predictions clearer
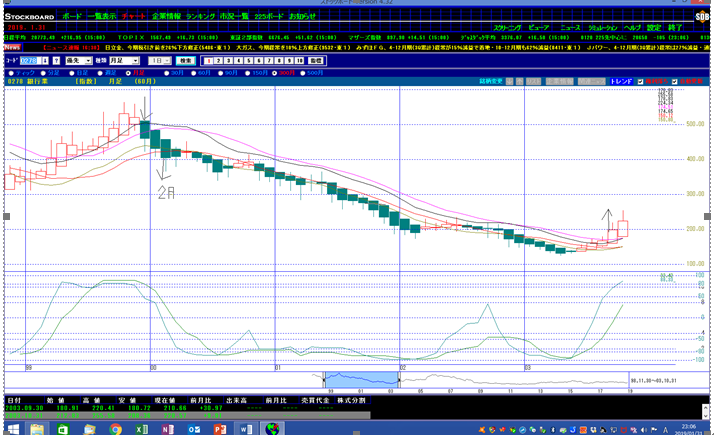
The R-factor on a monthly basis turned negative at the end of December of the previous year, meaning long positions had been taken to profit from selling
Furthermore, by the end of February 2000 there was a complete shift to selling,with a clear downward trend indicated by a series of down days,.
The Nikkei Average on a monthly basis showed continued rise from December to February,an obvious rise without substance,i.e., a rise with no depth.
The monthly top pattern occurs when the R-factor continues to fall while the Nikkei Average continues to rise—an inverse phenomenon
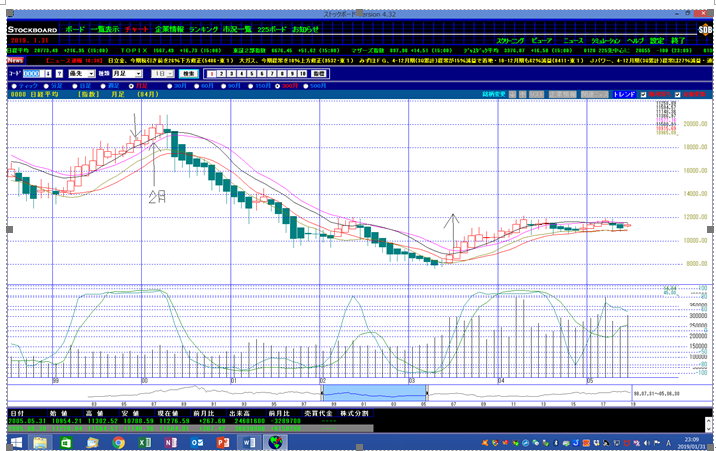
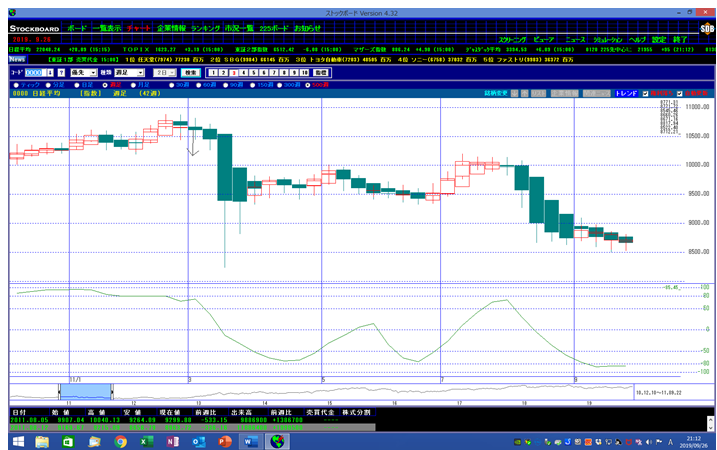
Please compare the Lehman Shock with the period from November 2006 to June 2007
The R-factor showed consecutive down days, while the Nikkei Average showed consecutive up days, so once a decline began
it followed a crash pattern of at least three years; 3.11 was the final blow.
Now, the forecast pattern by the weekly chart for that 3.11 crash was forewarned
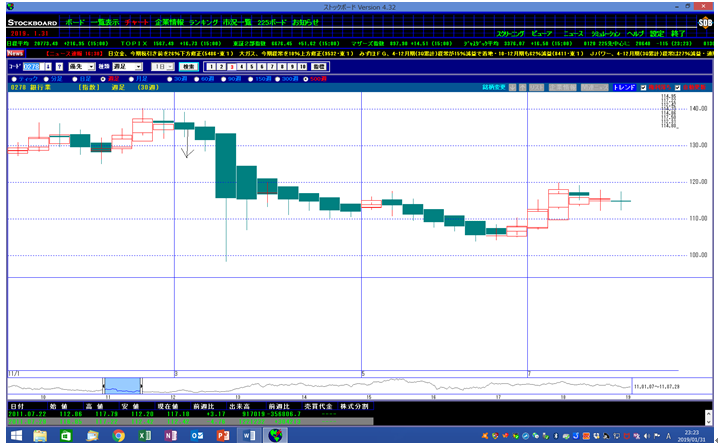
The R-factor also fully shifted to sell by the time of 3/4, aligning with the Nikkei Average in selling.
※ All seven co-movement indicators had already shifted to selling!
Disturbingly, our seven co-movement indicator charts forecasted the subsequent stagnation of Japan’s economy, industry, and household consumption after 3.11, in advance, at the time of 3/4.
There is a urban legend that the 3.11 Great East Japan Earthquake was caused by earthquake weapons, but…
This forecasting know-how indicates that investors who knew in advance about a major drop may have sold short or engaged in short selling.
While we cited a painful earthquake example, this is the world of the market.
During that crash, individual investors who held long positions in 225 futures were devastated.
When customers could not pay the margin calls, securities firms bore the losses and some even ceased or transferred their 225 futures businesses.
We had already discovered the R-factor. Furthermore, from the second half of February onward, the major stocks’ monthly and weekly trends indicated a short-selling signal.
Also for 225 futures, as of 3/10 there was a sell signal, so we instructed members to sell 225 futures by email, and subsequent days were a huge victory.
In this newsletter, we will introduce techniques for yearly tops and bottoms based on the monthly comparison of the R-factor and the Nikkei Average, as well as medium-term trend forecasting on a weekly basis, using real market movements as teaching material.
Everyone grows accustomed to a bullish stance at market tops, thinking, “If I don’t buy stocks, I’ll miss out,” and at bottoms, the fear of a bottomless pit creates a reluctance to buy; the goal is to master chart analysis techniques that can read these crowd psychology signals.