Joh Jōko's Rising Ism ~ Full disclosure of how to set up the sparkle chart ~
Hello. I am Akiko Shiro, the Chartist.
The average is extending today as well, isn’t it?
Previously, when I explained how to set up the Sparkle Chart in a video with Rising Ideology, you requested that I teach the setup in text, so
this time I would like to explain it in text.
① Open the Monex Securities TradeStation app.
② Click the Trading App on the far left, then click in-app 【Chart Analysis】
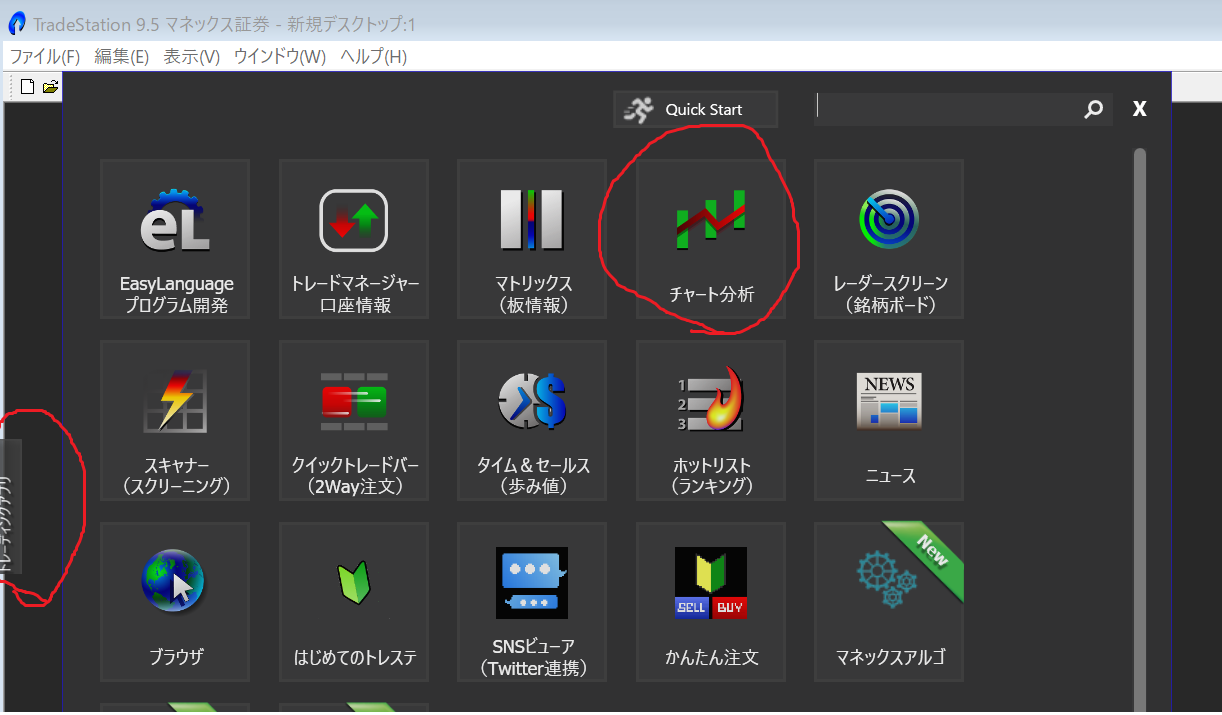
③ Right-click on the chart screen, then click 【Set Symbol Code】
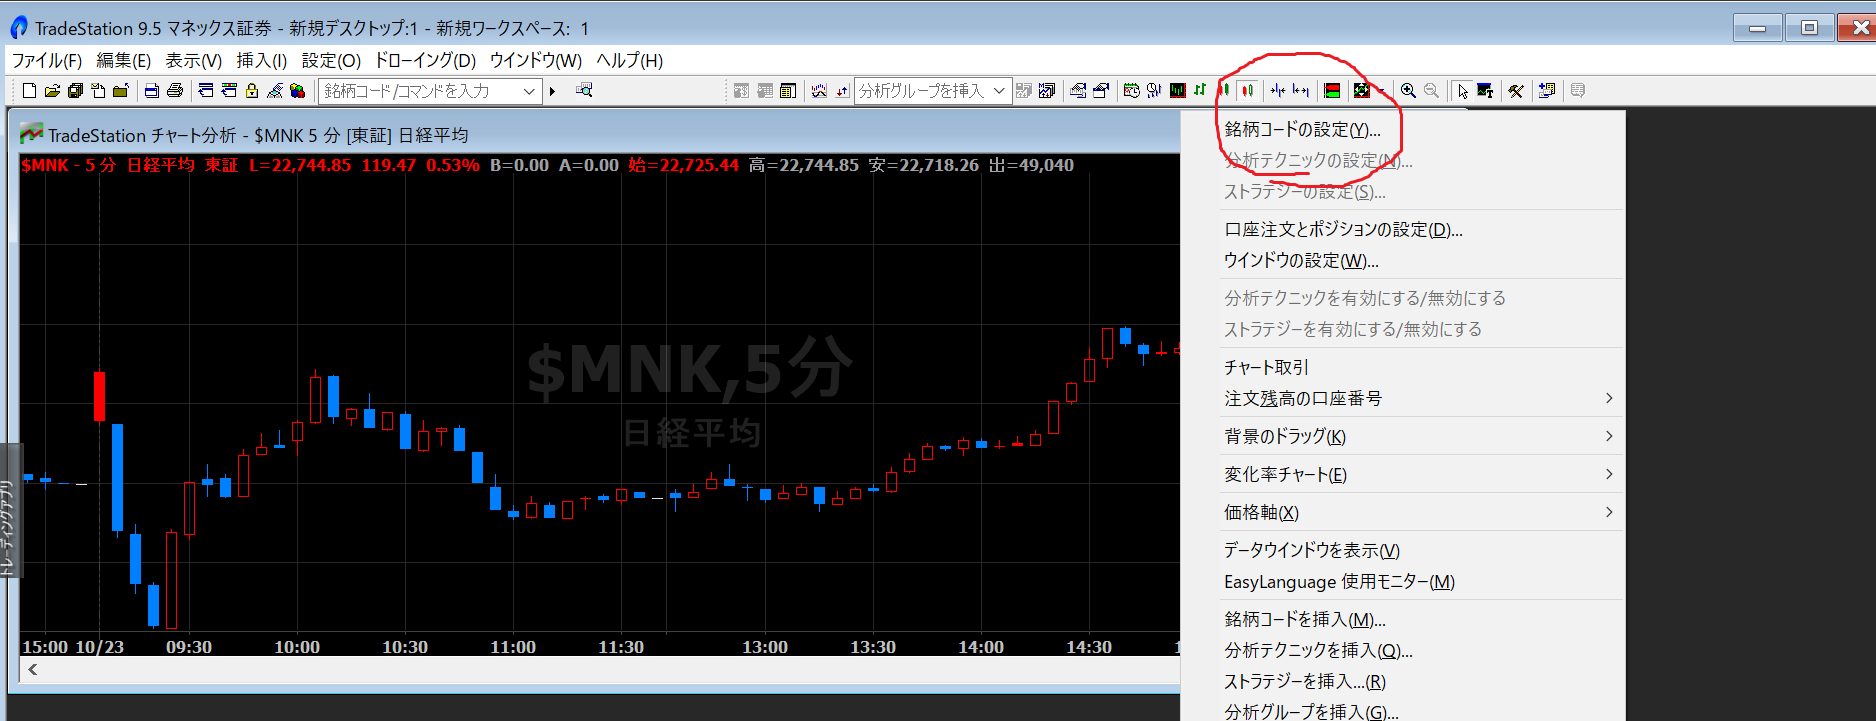
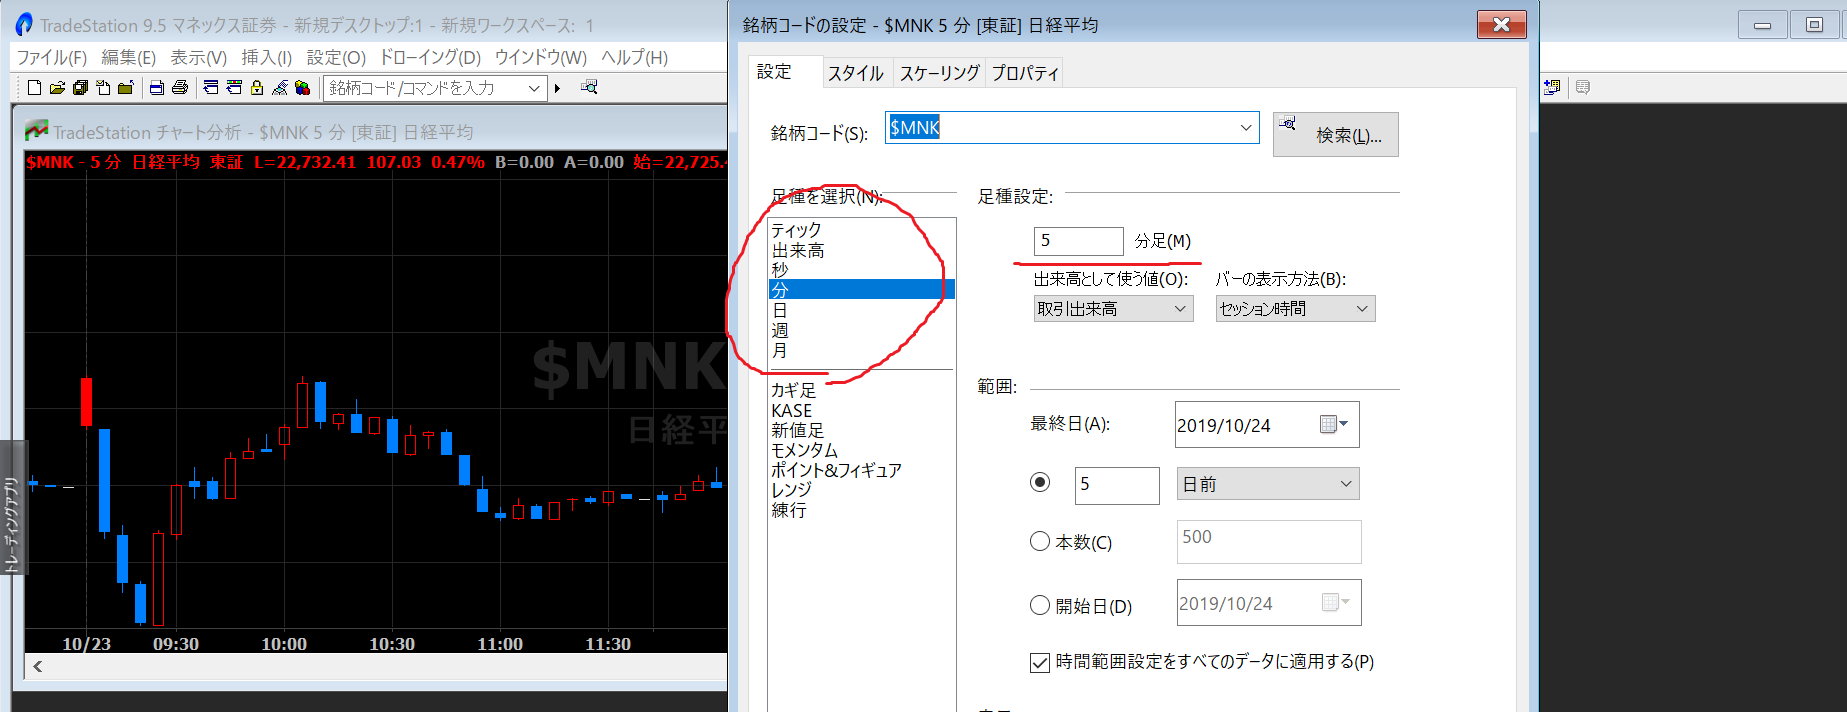
④ Change the bar type (e.g., change from 5-minute bars to daily bars)
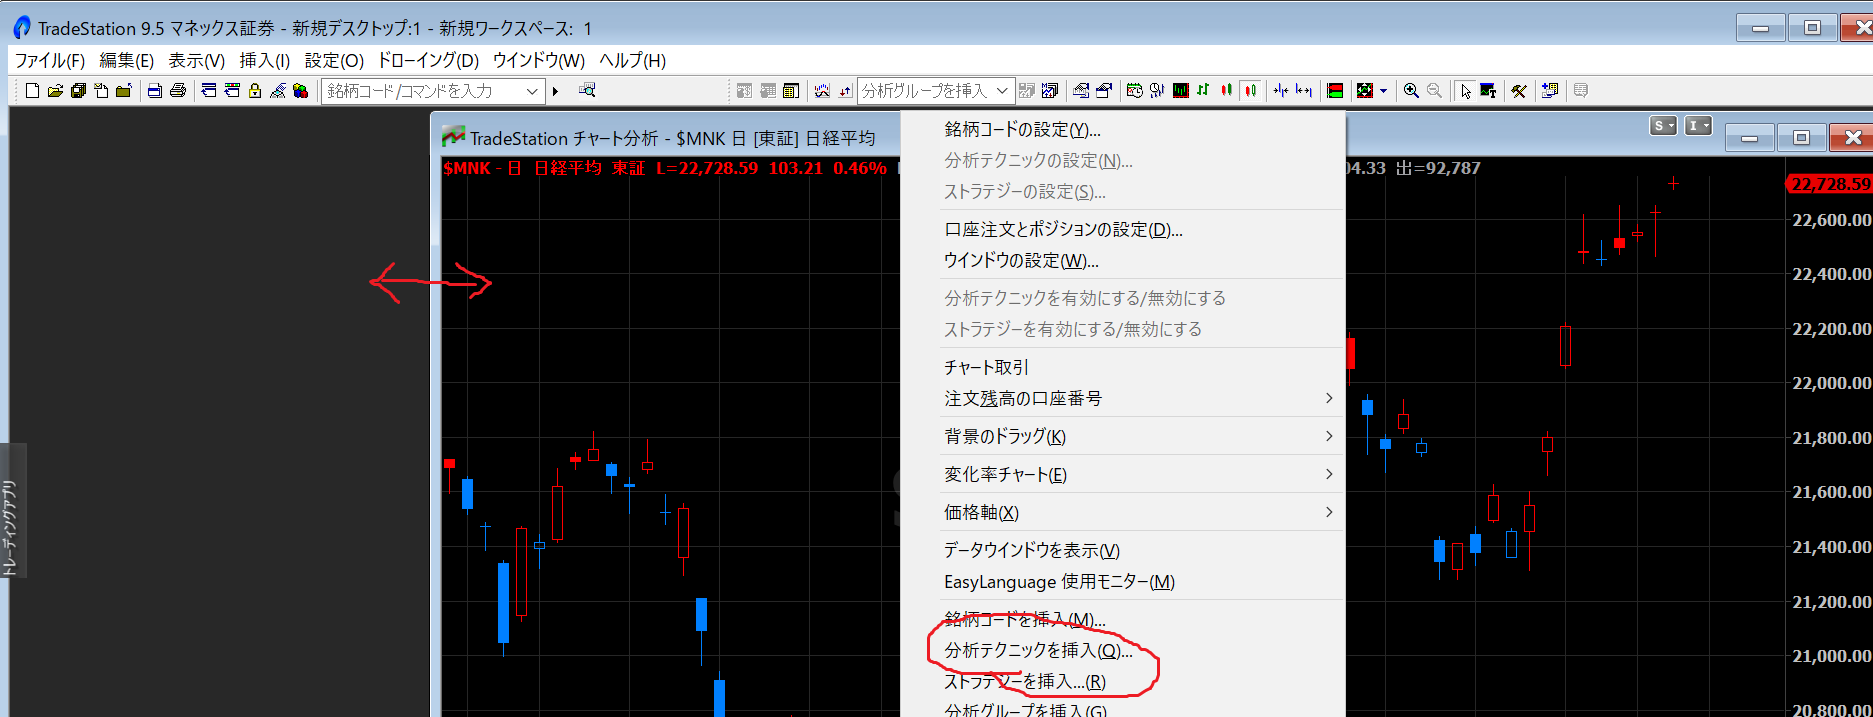
⑤ Hover the cursor and move the chart to the right.
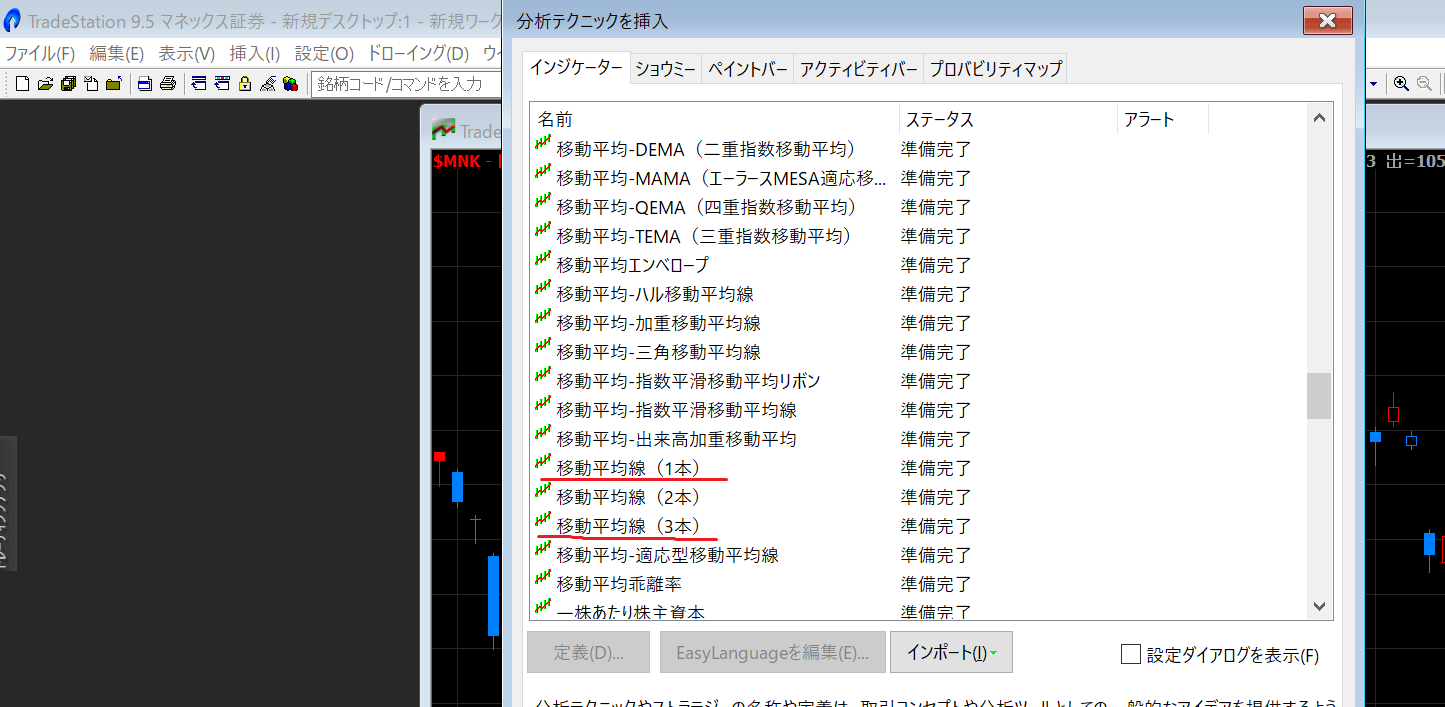
Right-click on the chart and click 【Insert Analysis Technique】
From the indicators,
• Moving Average (one line)
• Moving Averages (three lines)
• MACD
• Parabolic SAR
⑦ Click 【MACD Gradient】 from Paint Bar
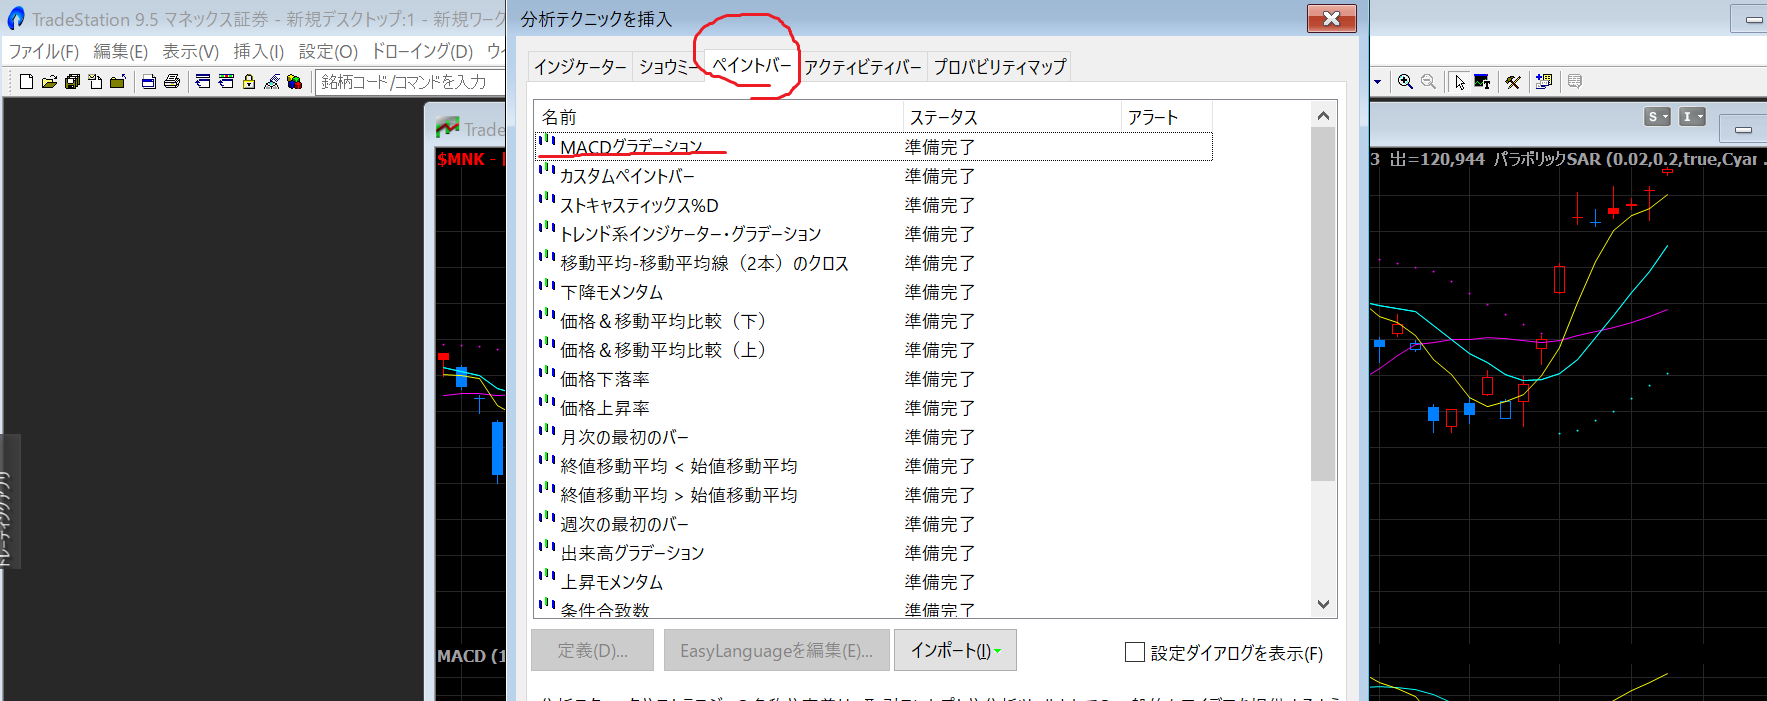
A beautiful gradient appears, doesn’t it?
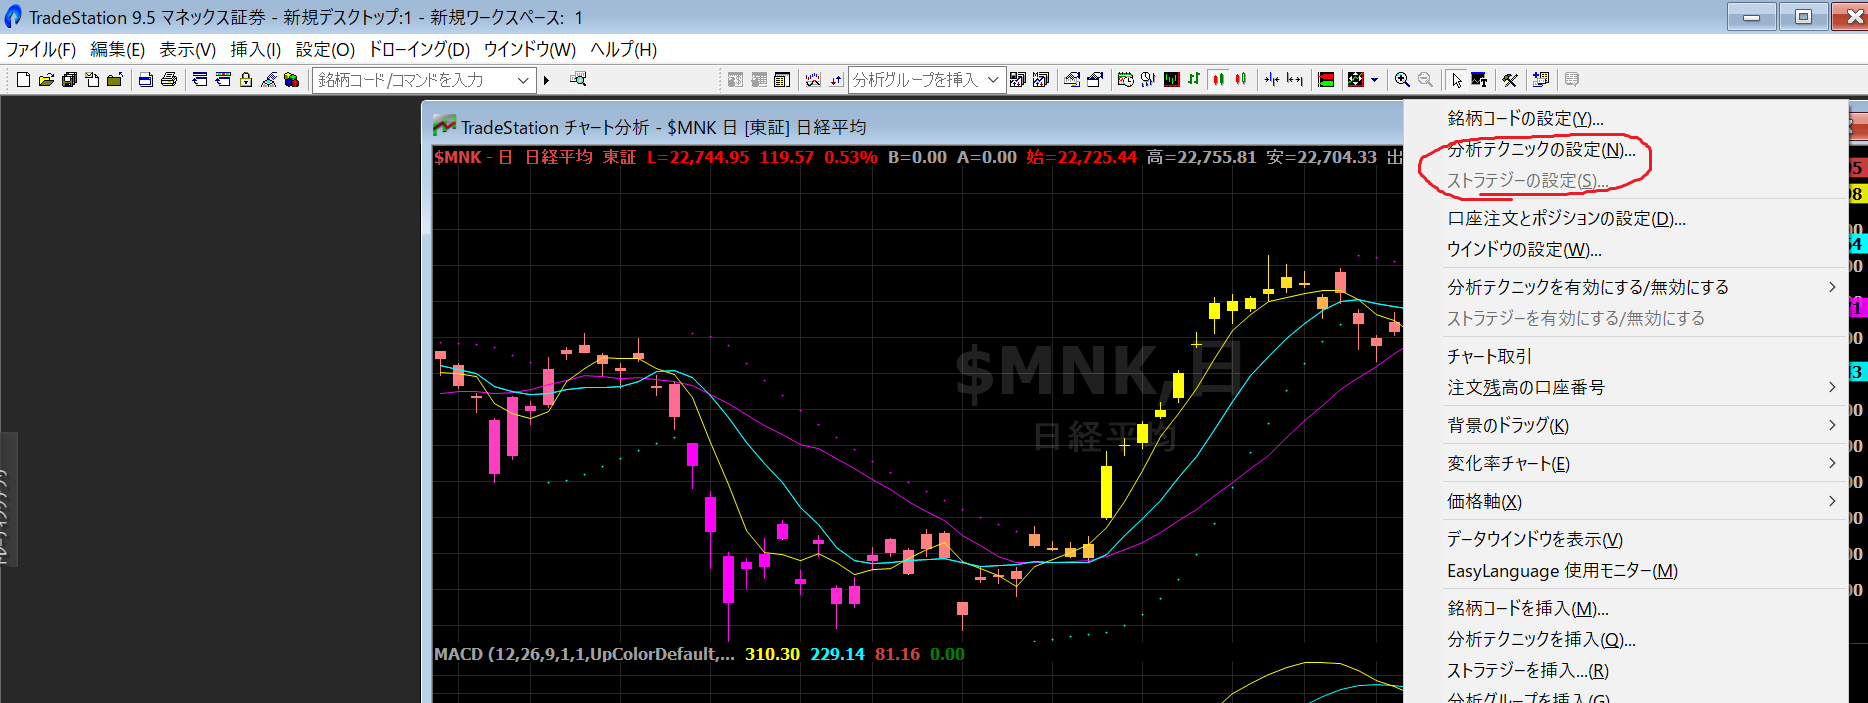
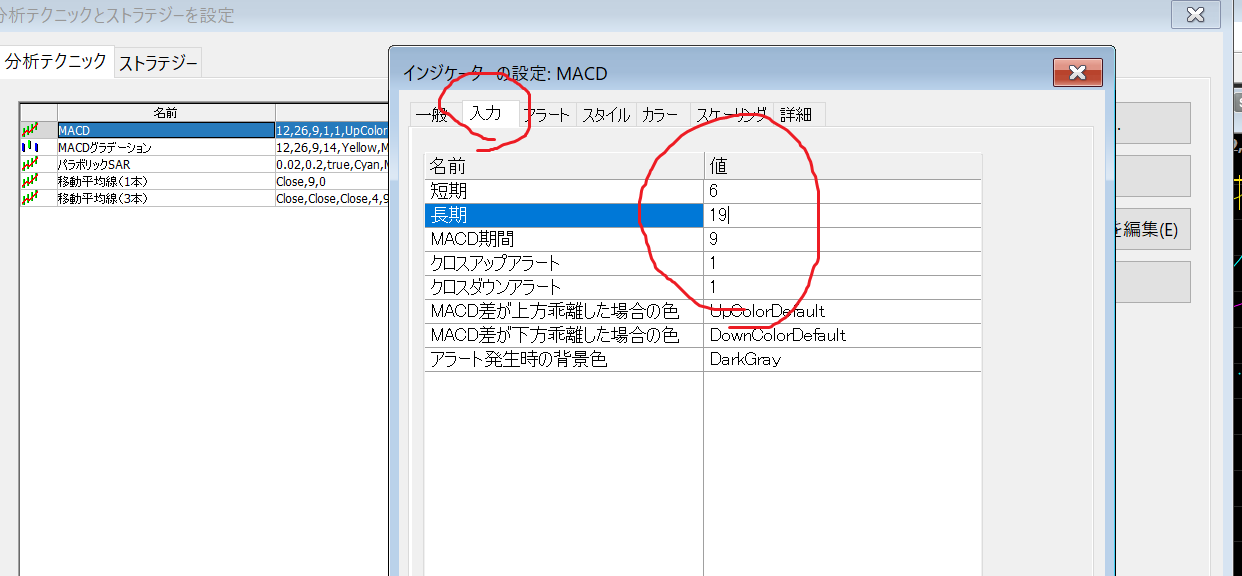
⑧ Right-click on the chart and click 【Settings for Analysis Techniques】
⑨ Click each item and click Settings
Change the values and styles to be set
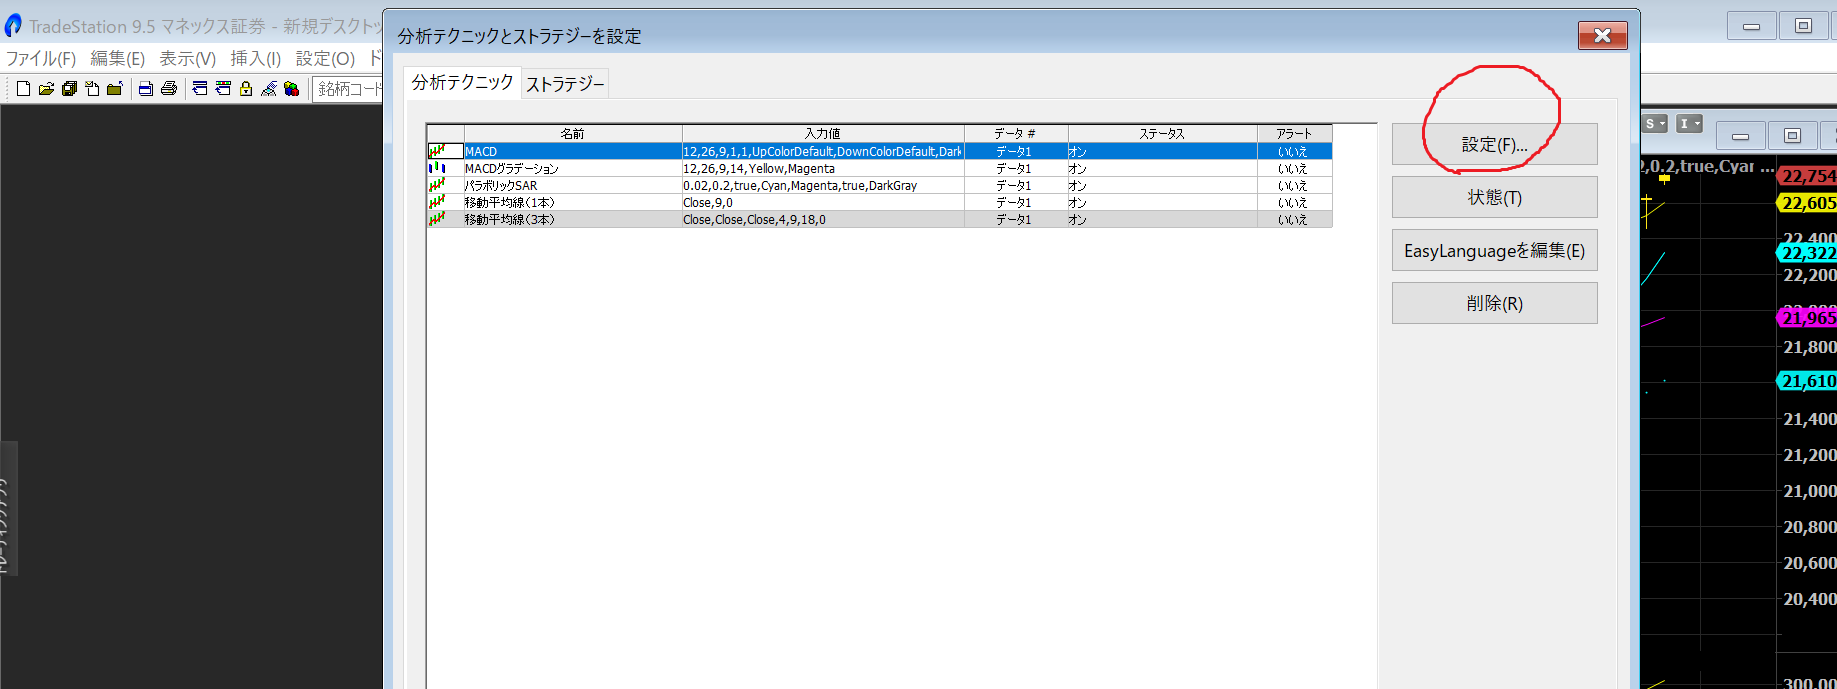
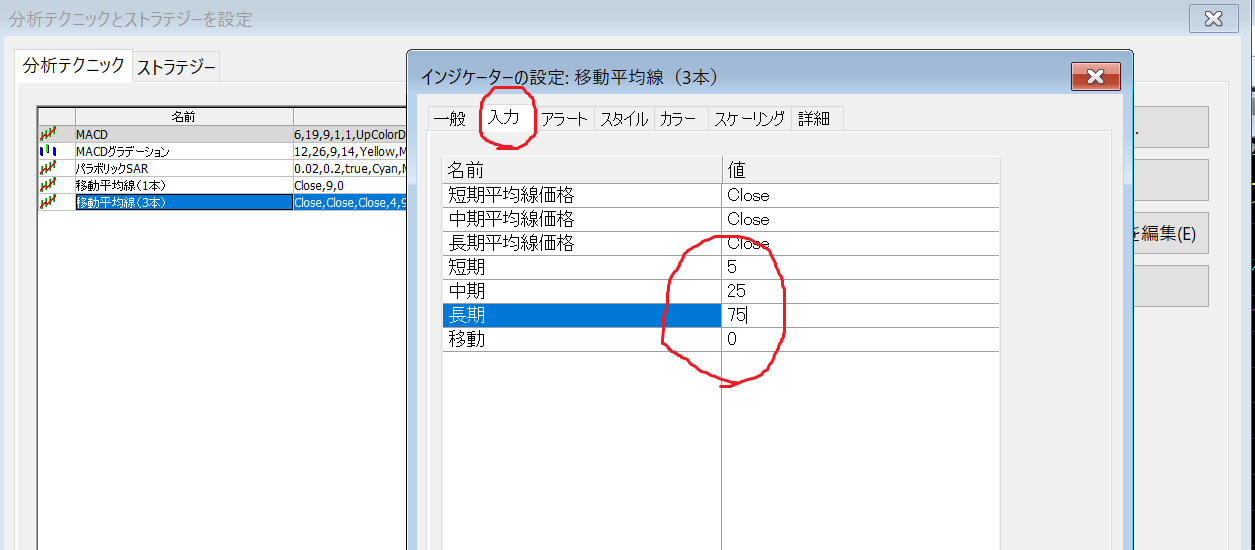
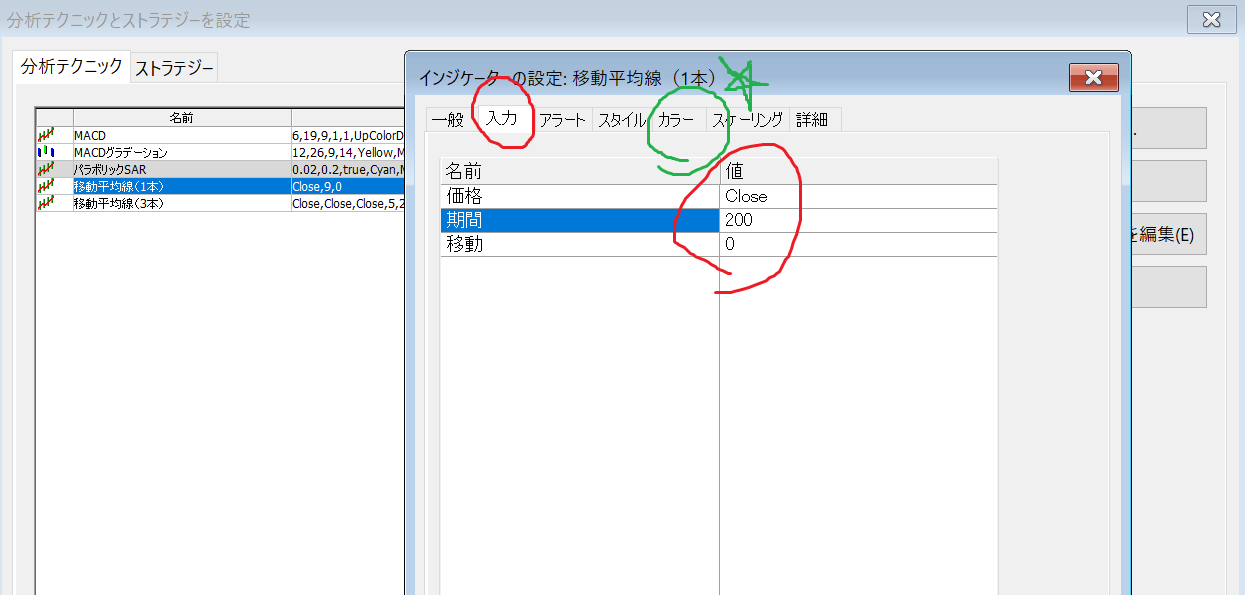
⑩ Each change is
• MACD short 6 long 19
• Moving Average (three lines) 5 / 25 / 75
• Moving Average (one line) 200 ※ change color
With these, the Sparkle Chart is created
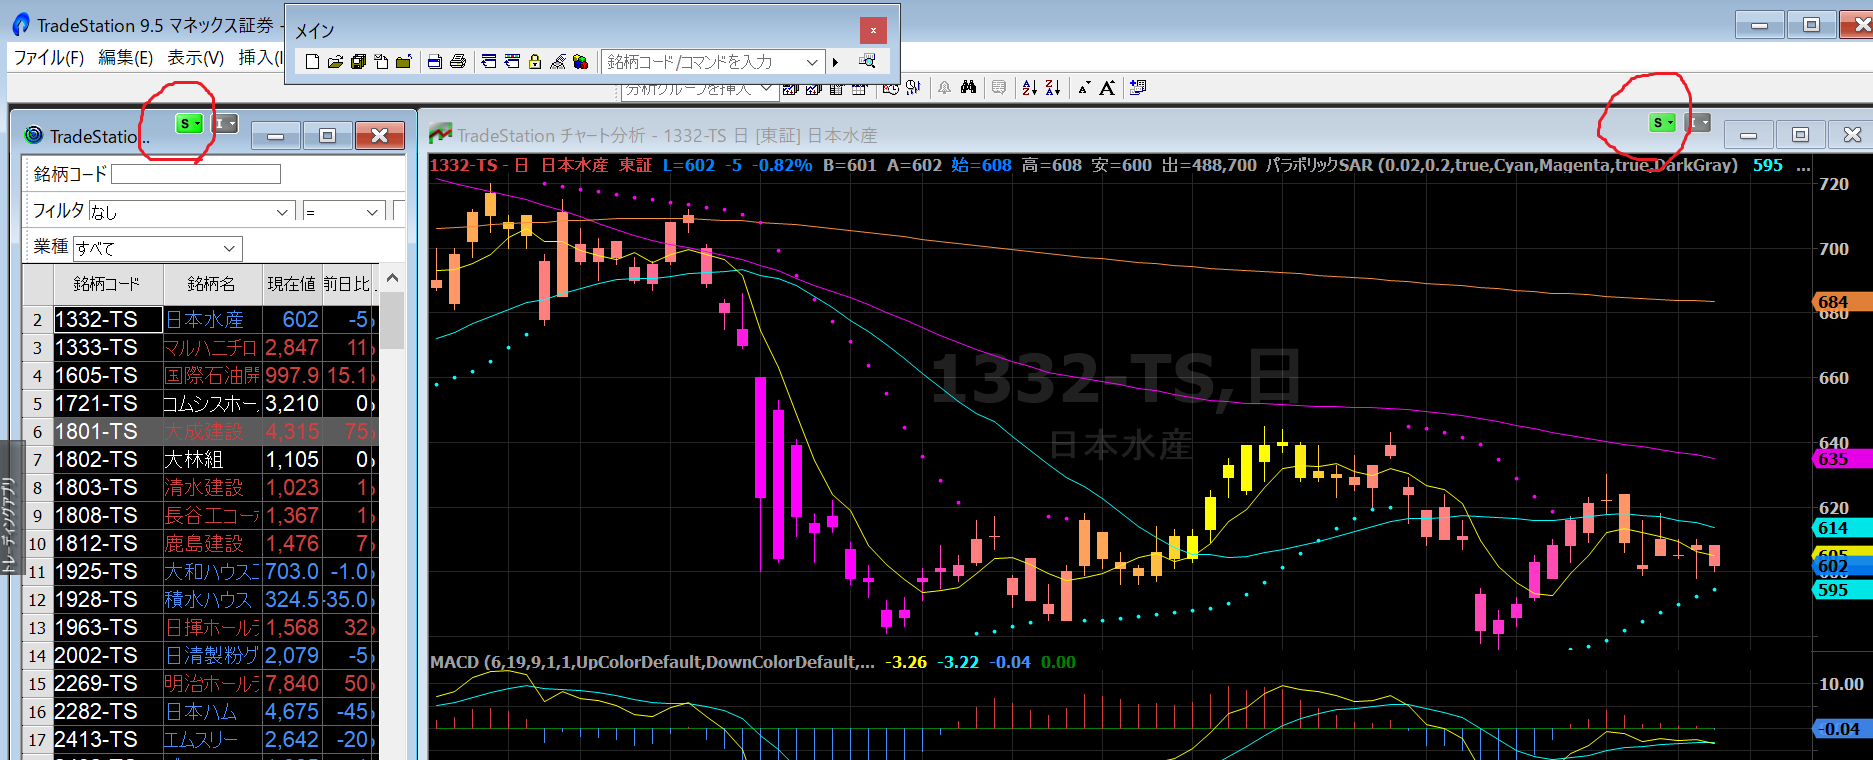
⑪ Additionally, from the Trading App, click 【Radar Screen】
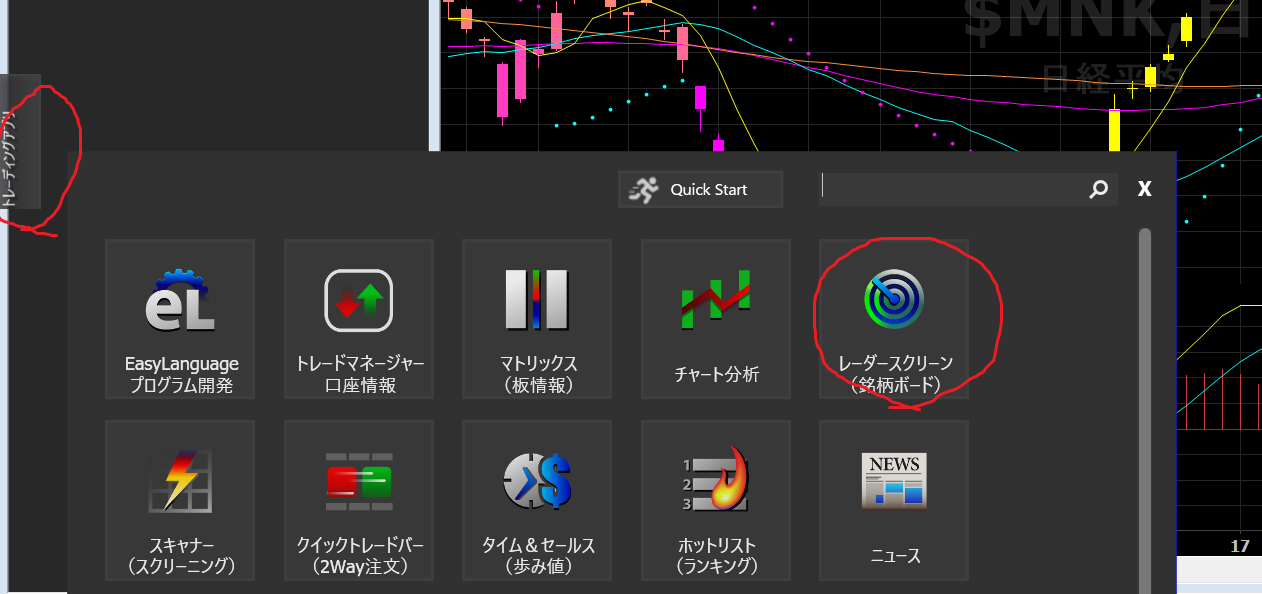
In the empty space on the left, place the Radar Screen by hovering the cursor,
Click to select the S mark 【Symbol Window Link】 to link both the radar screen and the chart in the same color
This links the chart and radar screen, so you can select a symbol code on the radar screen and press Enter to view that symbol’s chart, which is convenient.
Enter the watch list symbols and press Enter to check many charts!
This is the Sparkle Chart completed!!
Neither the buying nor selling opportunities are difficult to miss
Please make good use of the Sparkle Chart