With the magic of Fibonacci, the GBPJPY Blueprint that skillfully hits the "pullback price" and the "target price"


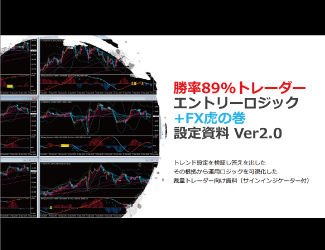
The "GBPJPY Blueprint" that suddenly appeared on GogoJungle in 2019.
It's a multi-page PDF training material (product), but the reviews are favorable, and many people may be curious about what's inside.
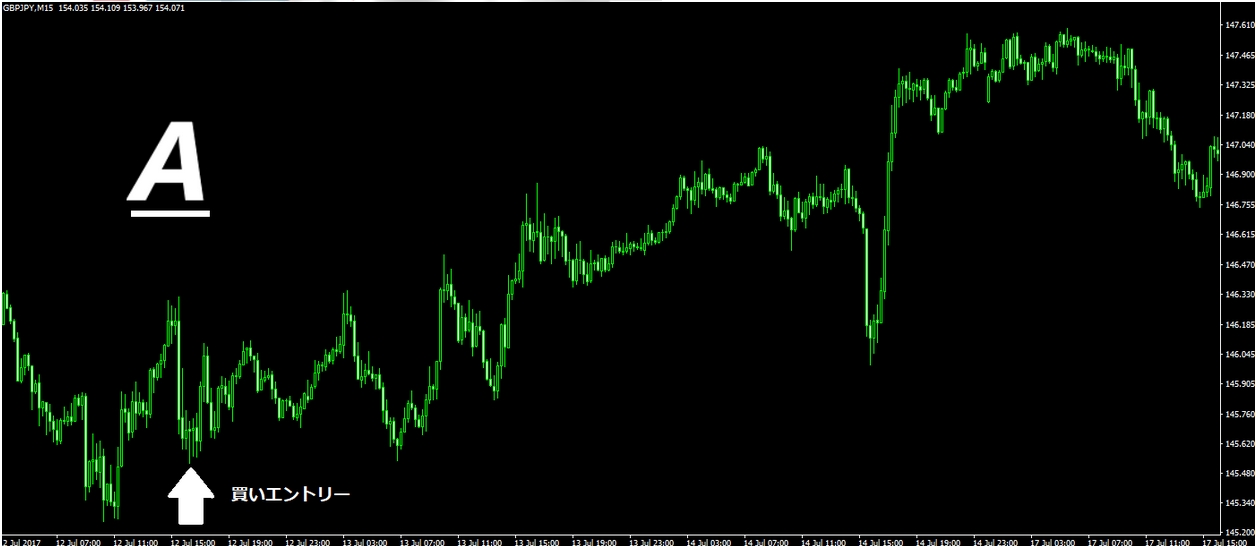
The sales page says you can enter at the arrow points like in the diagram, but
can you really enter at such a pullback in the first wave of a trend?!
Let's start by looking at the reviews.
■ Evaluation varies depending on how you interpret it
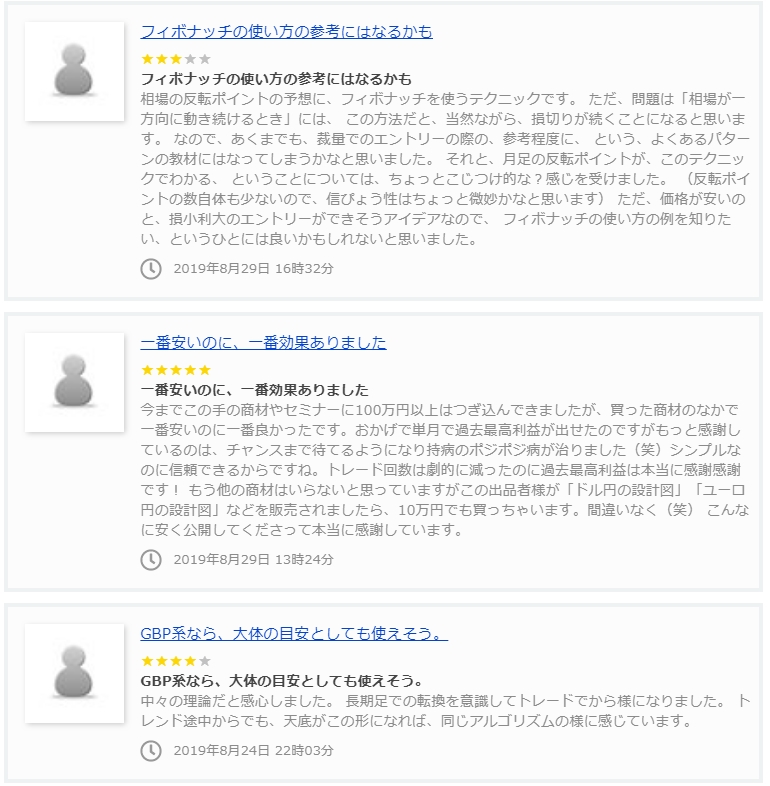
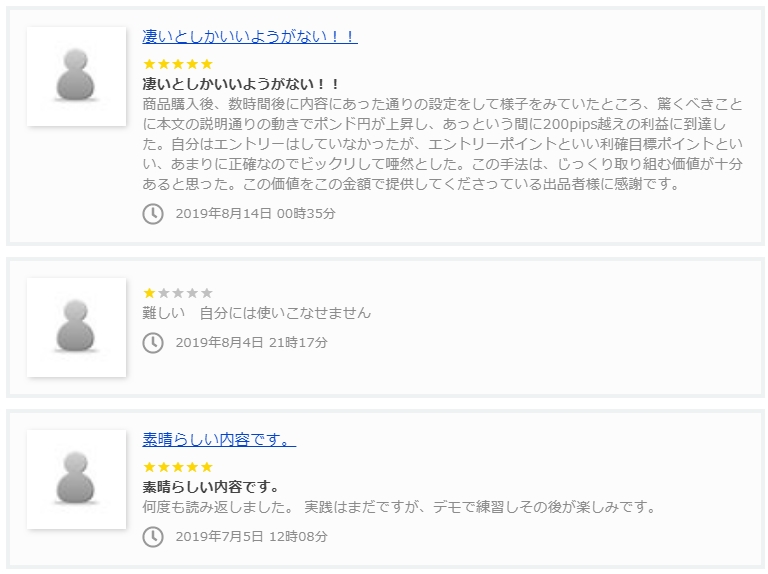
Impressions range from "difficult" to "amazing," and the reaction seems to vary depending on the recipient's knowledge and level.
■ The content is chart analysis using proprietary Fibonacci levels
The sales page doesn't describe the method's content or logic, but hints are in the reviews, so if you reveal them,
"an original method using proprietary Fibonacci levels" is what becomes clear.
Fibonacci is often used in the typical way by applying 0% and 100% to the high and low of a major trend, aiming for retracements to 32.8%, 50%, and 61.8% to trade in the direction of the trend, but this original method is"to determine the pullback after a trend reversal (retrace) and the target values using a proprietary Fibonacci".
Of course, which timeframe to use and where to set the starting point of the Fibonacci are down to individual discretion, so I don't think it's 100% reproducible.
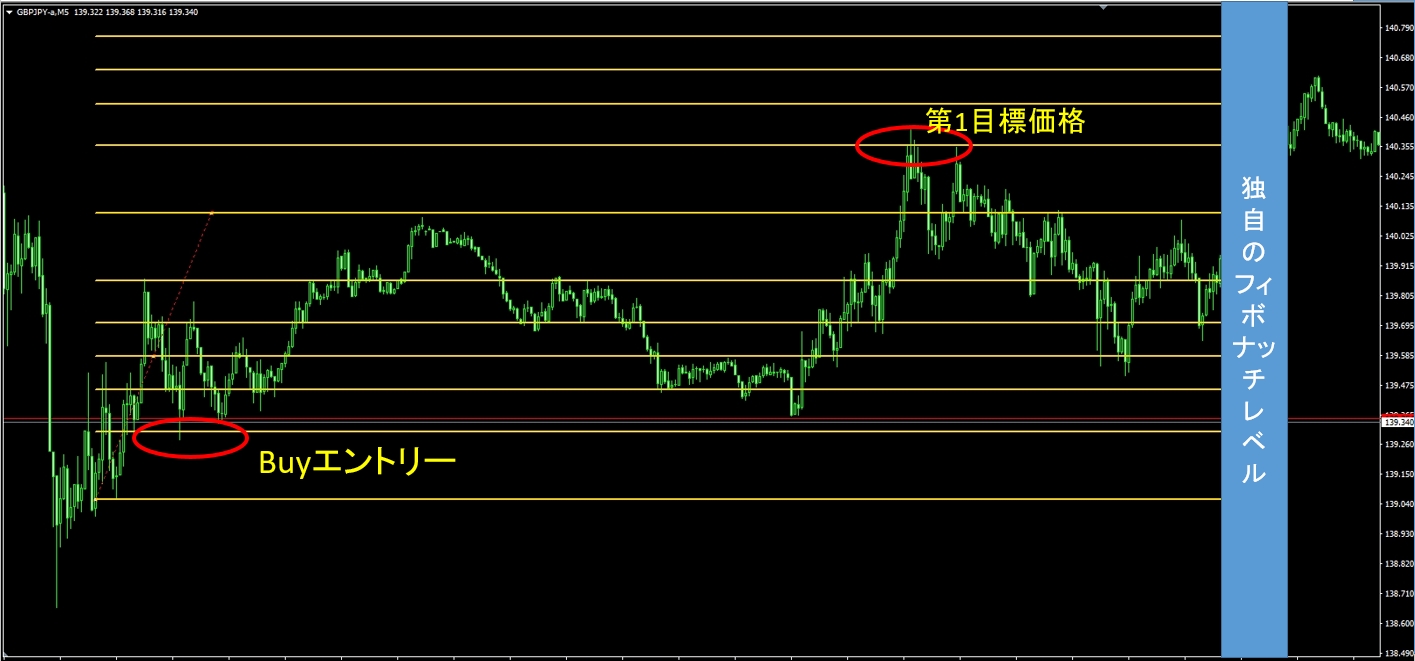
■ I tested this method on the most recent GBPJPY 5-minute chart
Having interpreted the method in my own way, I applied it to the latest GBPJPY 5-minute chart.
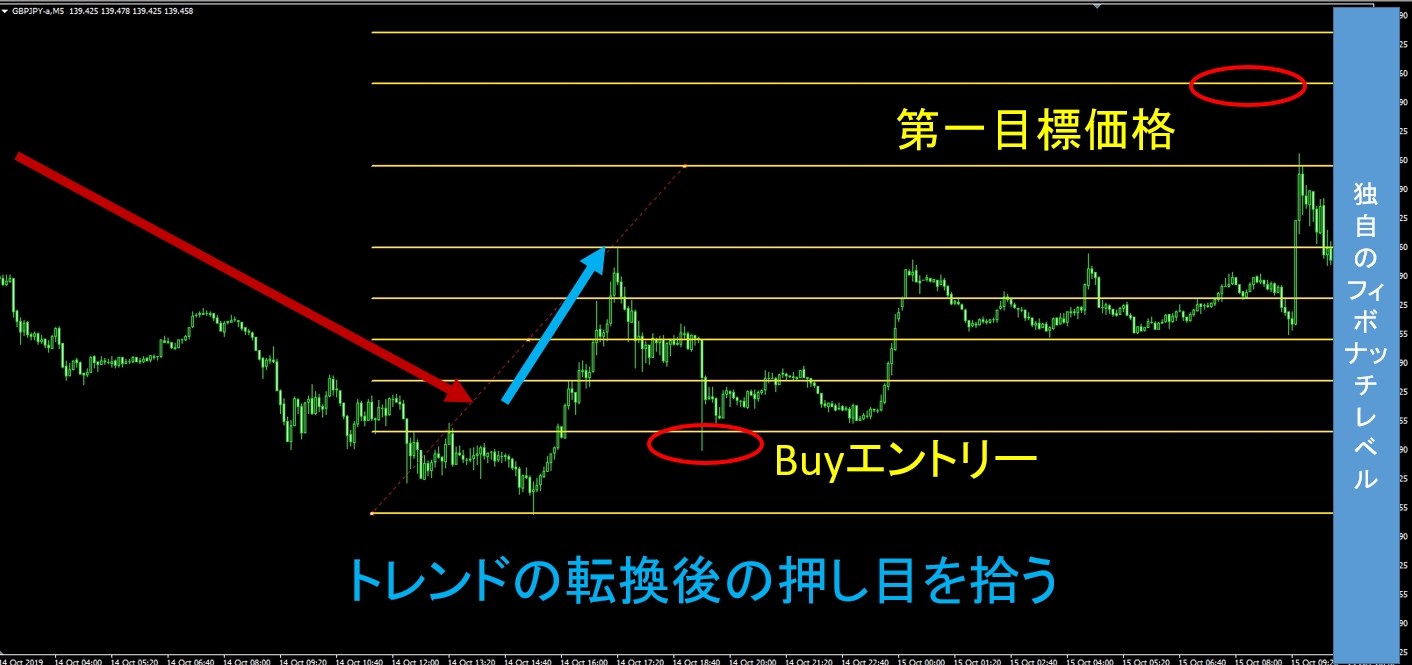
△GBPJPY5-minute chart. Based on the post-trend-reversal low and high, apply the proprietary Fibonacci and determine the entry line and the take-profit target line.
There are first and second target prices.
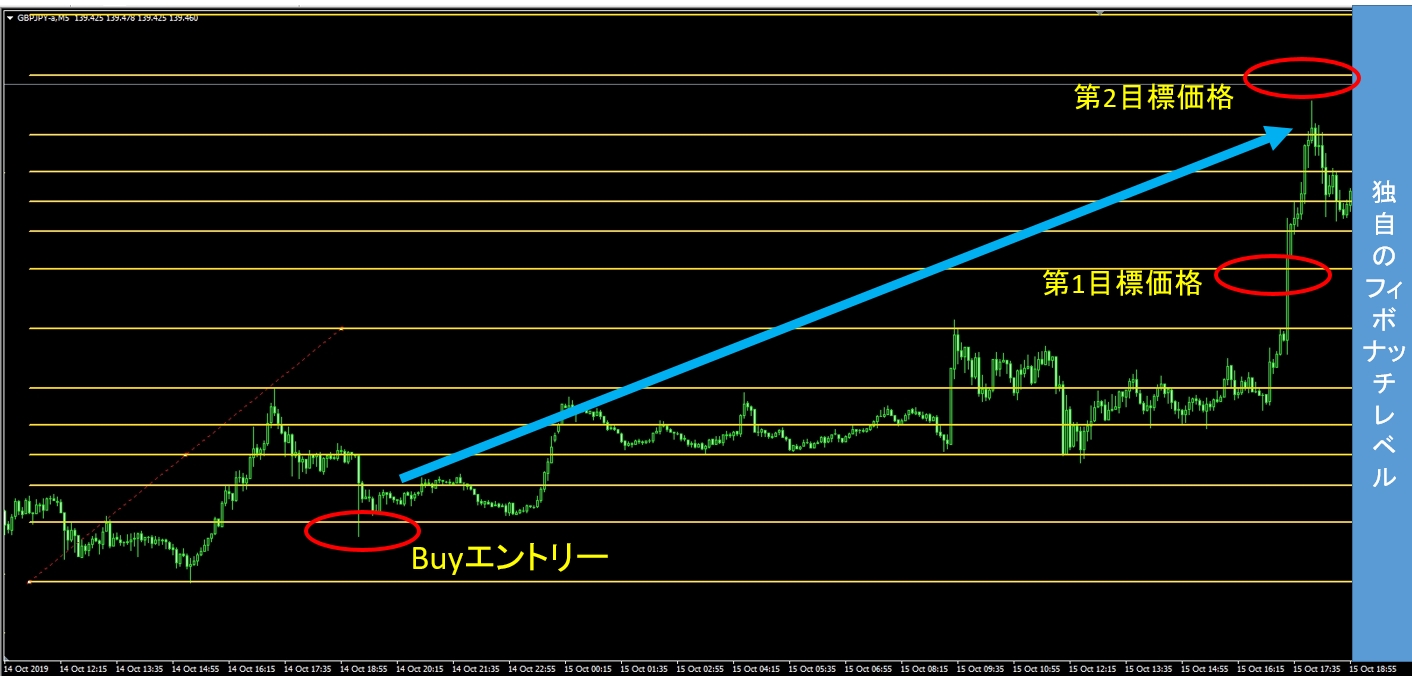
From the BUY entry line, it hovered for a while without reaching the target, but ultimately reached the first target price.
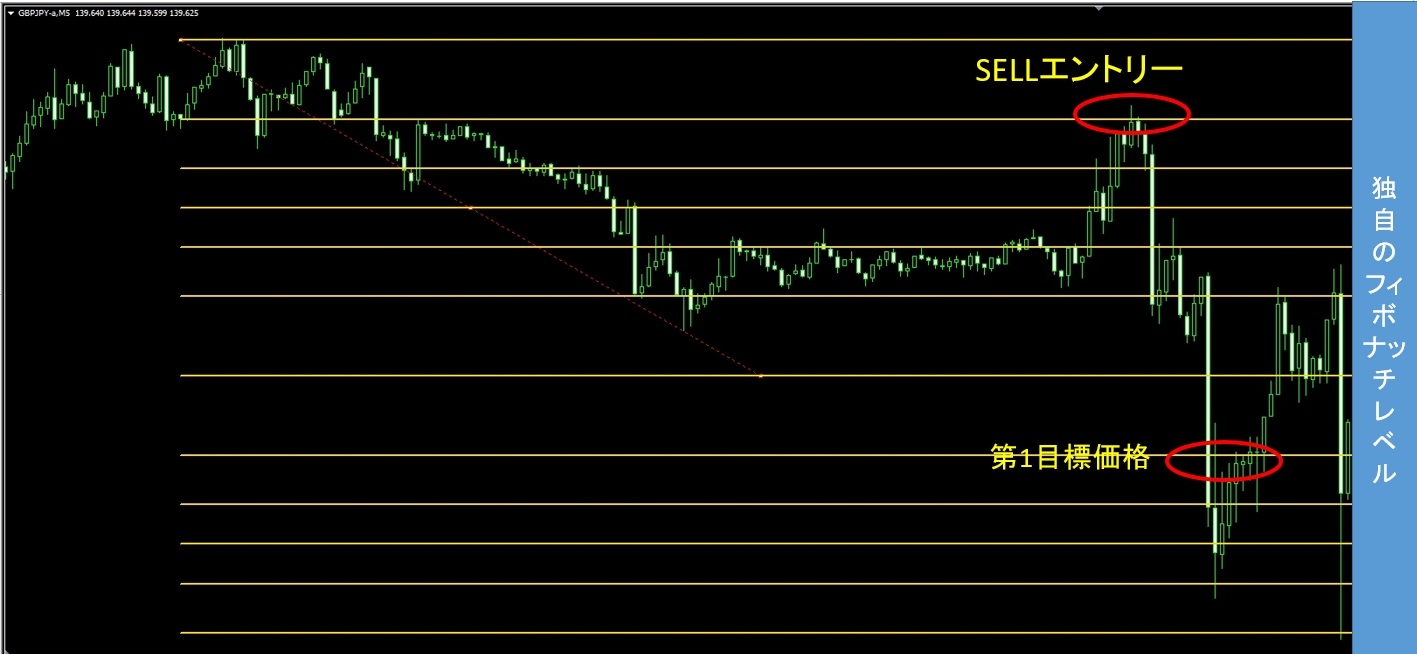
Of course there are cases where it moves against you and hits a stop loss, but since the distance to the stop loss is narrower than the take-profit target, the damage is not too big even if stopped out.
How to determine the shift of the high and low after a trend reversal? There isn’t a shortcut—you basically need to study past charts and practice many times, but
knowing the target price to some extent can encourage longer holding for those who think it might go further, acting as a push to take profits.
After entry, the price may revert back to the entry level without reaching the target price.
You can exit by stopping out at the preset stop-loss at the 0 level, or close at breakeven.
One strong advantage is that you can set the stop-loss line and the first and second take-profit lines at entry (you might even set the first line as the trailing-stop start price).
■ Recommended for those who have doubted Fibonacci
If you've used Fibonacci before but weren't sure how to apply it to trading, or didn't know where to start drawing Fibonacci from, the rules are clear, so with practice you can quickly find good entry points.
■ Dow Theory understanding is necessary
It's a relatively simple original method, but the discretionary part of where to draw Fibonacci inevitably arises.
At minimum,"the high-low swap that marks a trend reversal" should be learnable, which will help you use it more effectively.
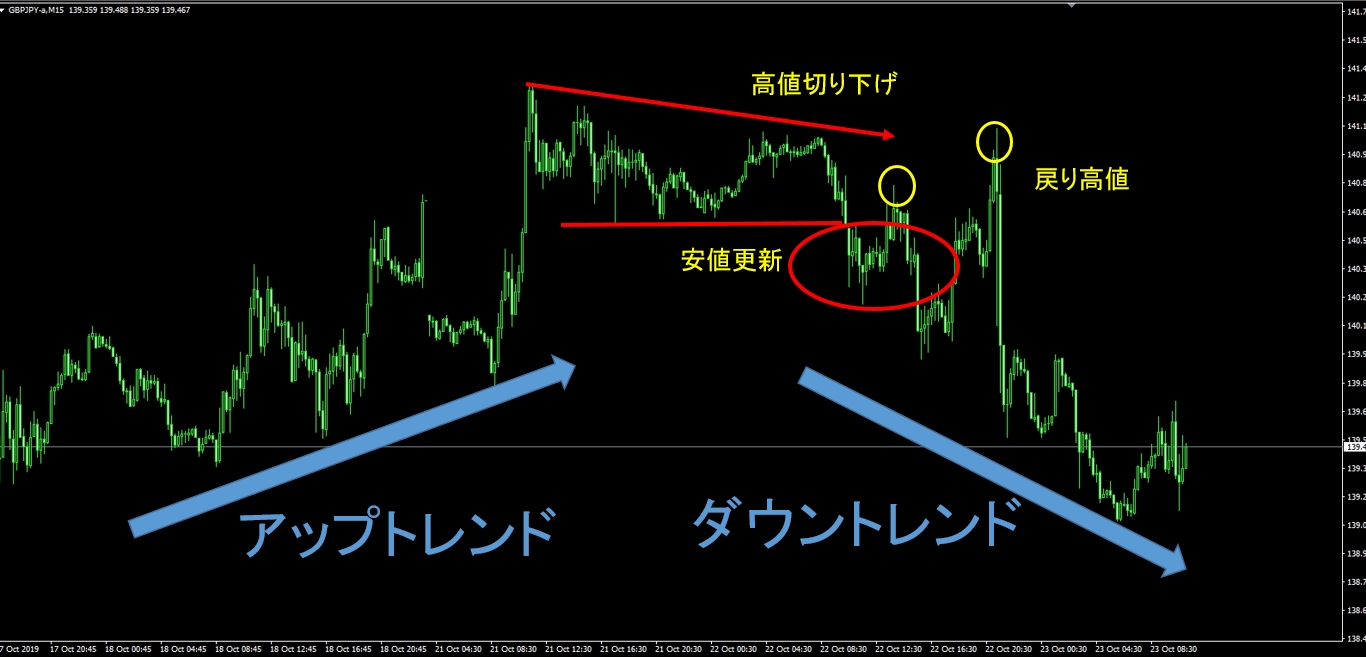
△ In an uptrend, it had continued with higher highs and higher lows until highs stopped updating, the most recent low was broken, and the retrace high no longer exceeded the previous high, signaling a shift to a downtrend.There are periods of wide-ranging markets or consolidation, so it's not always possible to strictly categorize as uptrend or downtrend.
It's not a convenient indicator that gives signals, but as one of the bases for entry and take-profit points, it was a very interesting original method.
written by Tera Gogojungle Marketing.