Jo Jyoko's Rise Ideology ~ October 21 Buy/Sell Disclosure in Full — How to Read the Buy Point on the Sparkling Chart ~
Hello. I am Akiko Shou Kasumi, the Kirameki Chartist.
Yesterday, for the enthronement ceremony, Tokyo had more police officers from all over the country than usual, creating an atmosphere that felt different from usual.
During the ceremony, a rainbow appeared, and it seemed as if the weather itself was celebrating the dawn of Japan's new era.
Many of you have asked me how to use the Kirameki Chart in a practical way.
So I thought that by showing my actual trading, I might be able to help everyone a little, and I plan to post my daily trades little by little.
I update it daily on Ameblo, so if you're curious, please search for “Shou Akiko’s Beautiful Stock Weather.”
Today, October 21, the Nikkei Average was somewhat firm.
I could only trade in the morning session, but
7748 Horon
Five-minute chart; the period shown is from 11:30 on October 18 to the close on October 21.
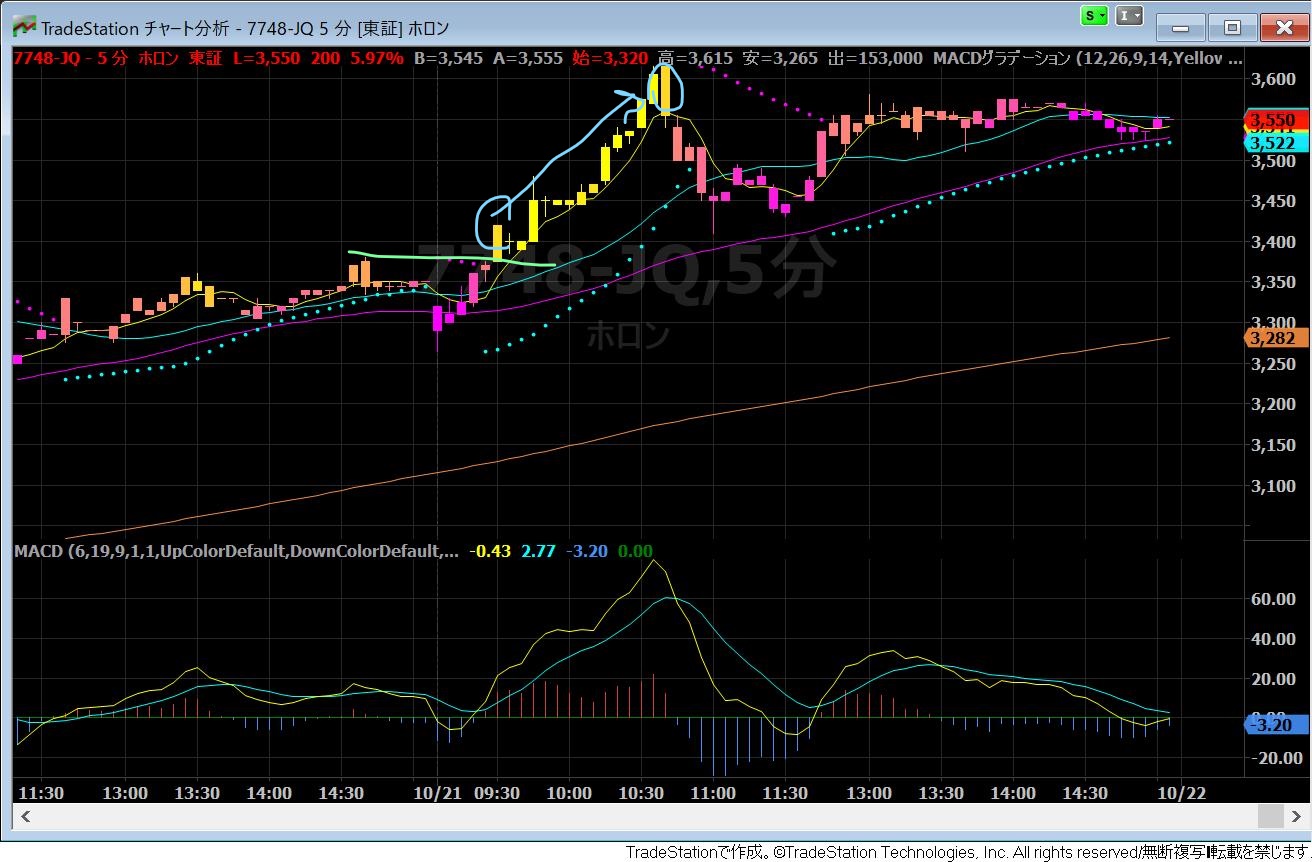
It started with a drop at the open,
and I entered when it surpassed the previous high.
Where should I enter? If you're a trader, you've probably wondered at least once.
I enter when six conditions line up.
If they don't, I absolutely do not enter.
This is my long-standing set of personal rules
1. It breaks the previous high
2. The gradient improves
3. MACD crosses above the 0 line
4. The histogram improves (red)
5. Parabolic shows an upward signal in light blue
6. The order of moving averages is short, medium, long
Following this rule, you won’t have to wonder about the buying point!!
Moreover, it’s visually clear thanks to the Kirameki Chart!!
You can see the entry point at a glance, right?
Now, let's take a look at Horon's daily chart!
7748 Horon
Daily chart period is from June 1 to October 21
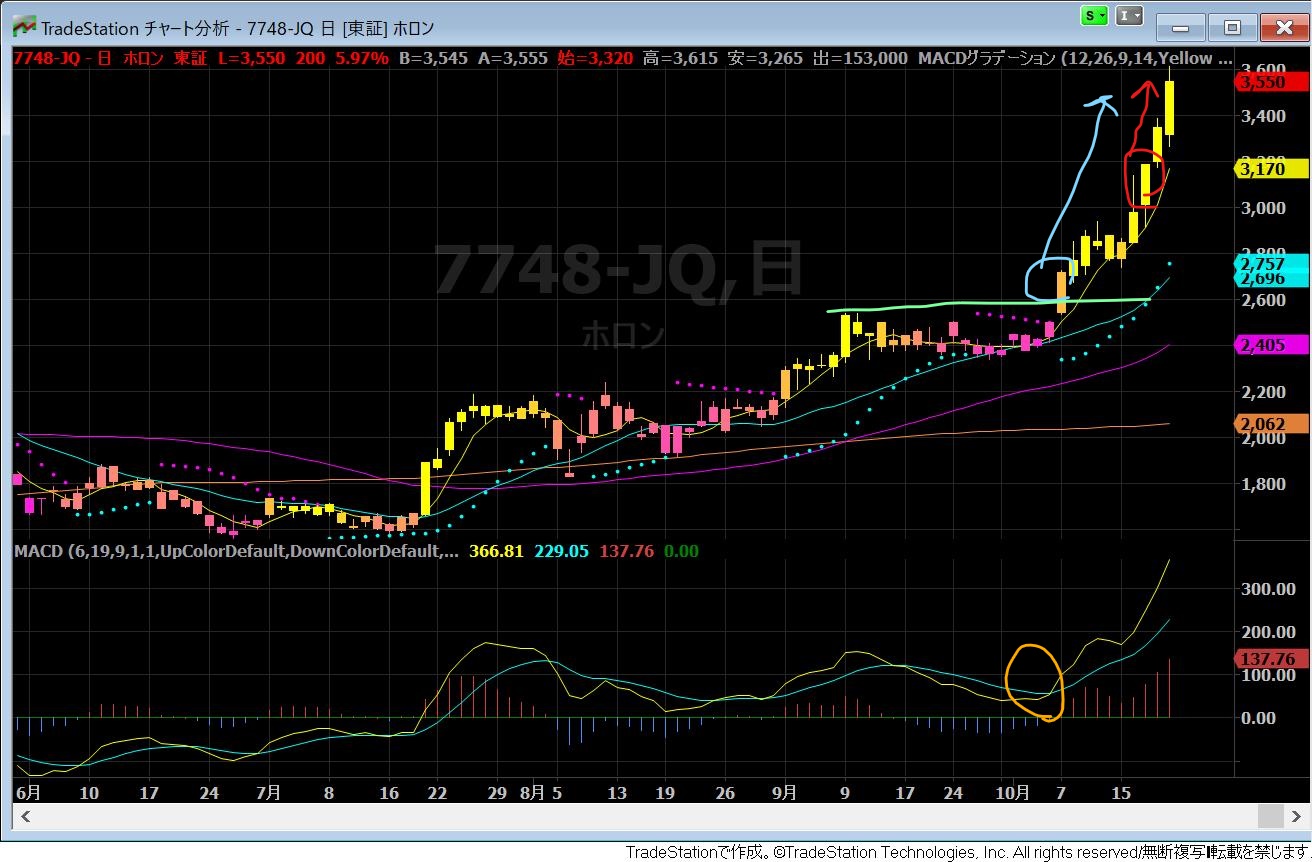
As you can see on Kirameki Chart's daily chart,
1. It surpasses the previous high,
2. The gradient improves,
3. MACD crosses above the 0 line
4. Histogram is red as well.
5. The arrangement of moving averages is OK
6. Parabolic is rising, shown in light blue
Even if you couldn't enter at this point,
it’s OK to enter when the candle's upper wick closes after a pullback to the five-day moving average
In this way,
the Kirameki Chart
can be used for short-term trading, mid-term trading, and even long-term trading comparable to looking at weekly or monthly charts
I have read many books on stocks, but if you’re struggling to trade well, this is your ally!
That is the Kirameki Chart
Please feel free to use it as well.